| __timestamp | Gen Digital Inc. | QUALCOMM Incorporated |
|---|---|---|
| Wednesday, January 1, 2014 | 6676000000 | 26487000000 |
| Thursday, January 1, 2015 | 6508000000 | 25281000000 |
| Friday, January 1, 2016 | 3600000000 | 23554000000 |
| Sunday, January 1, 2017 | 4019000000 | 22291000000 |
| Monday, January 1, 2018 | 4846000000 | 22732000000 |
| Tuesday, January 1, 2019 | 4731000000 | 24273000000 |
| Wednesday, January 1, 2020 | 2490000000 | 23531000000 |
| Friday, January 1, 2021 | 2551000000 | 33566000000 |
| Saturday, January 1, 2022 | 2796000000 | 44200000000 |
| Sunday, January 1, 2023 | 3338000000 | 35820000000 |
| Monday, January 1, 2024 | 3812000000 | 38962000000 |
Infusing magic into the data realm
In the ever-evolving landscape of technology, revenue trends offer a window into the strategic maneuvers of industry giants. Over the past decade, QUALCOMM Incorporated and Gen Digital Inc. have showcased contrasting revenue trajectories. From 2014 to 2024, QUALCOMM's revenue surged by approximately 47%, peaking in 2022, while Gen Digital experienced a 43% decline from its 2014 high, with a notable dip in 2020.
QUALCOMM's revenue growth, particularly a 26% leap in 2021, underscores its robust market positioning and innovation in wireless technology. This growth trajectory reflects its strategic investments and market expansion.
Conversely, Gen Digital's revenue faced a downturn, with a significant 62% drop by 2020. However, a recovery trend is evident, with a 53% increase from 2020 to 2024, signaling potential strategic realignments.
These insights highlight the dynamic nature of the tech industry, where adaptability and innovation are key to sustained growth.
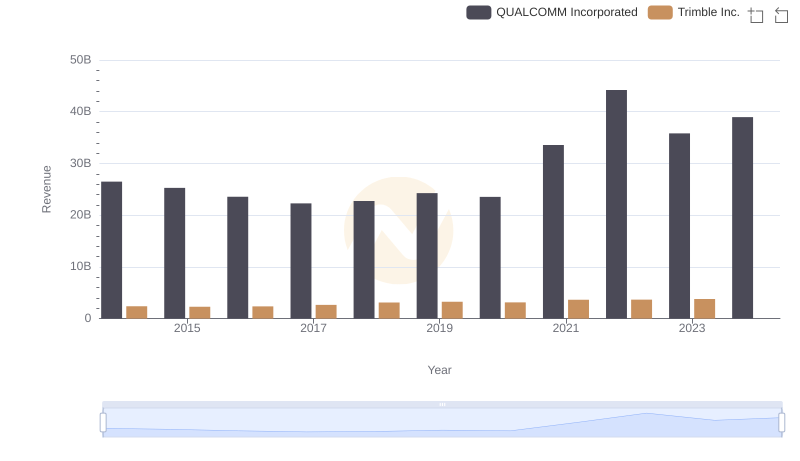
Revenue Insights: QUALCOMM Incorporated and Trimble Inc. Performance Compared
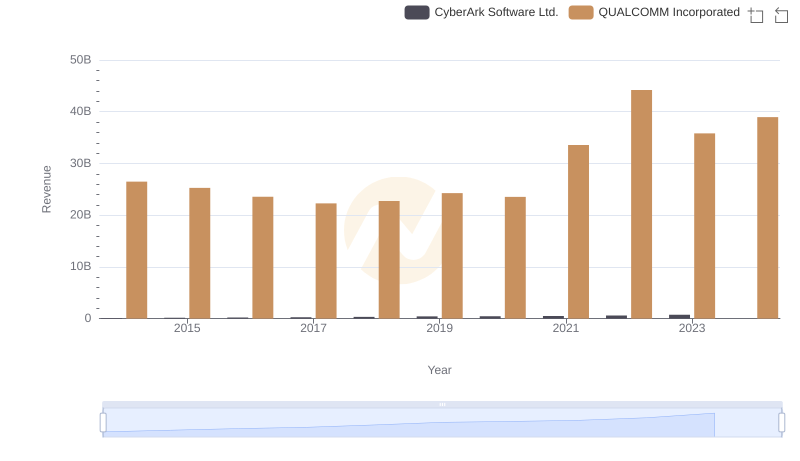
QUALCOMM Incorporated vs CyberArk Software Ltd.: Annual Revenue Growth Compared
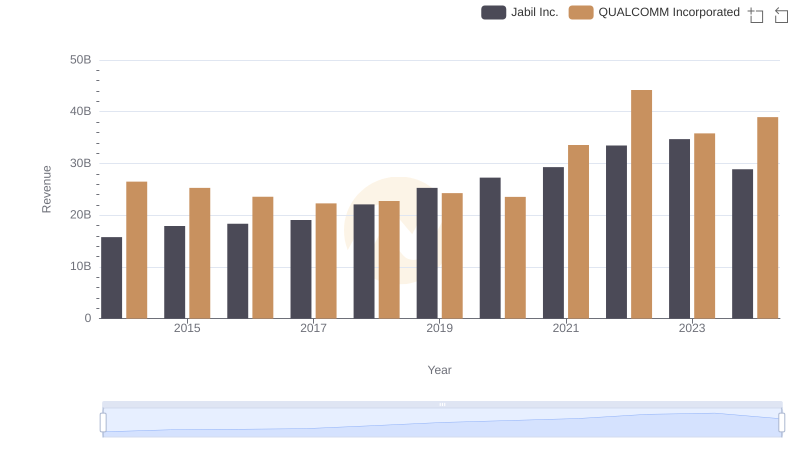
Breaking Down Revenue Trends: QUALCOMM Incorporated vs Jabil Inc.
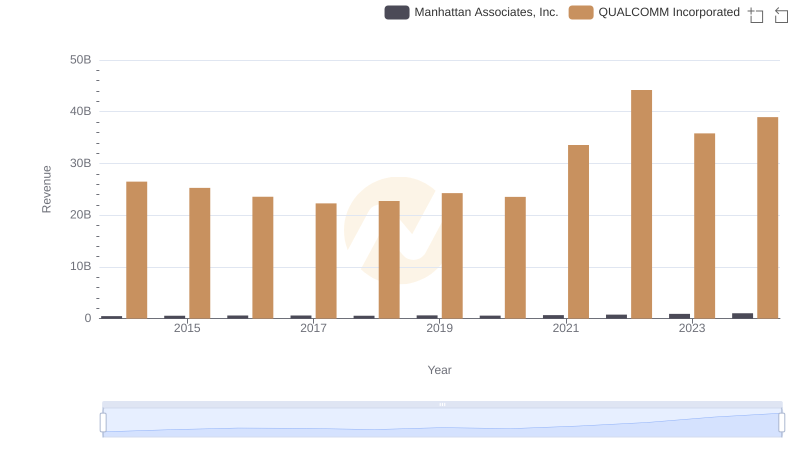
Who Generates More Revenue? QUALCOMM Incorporated or Manhattan Associates, Inc.
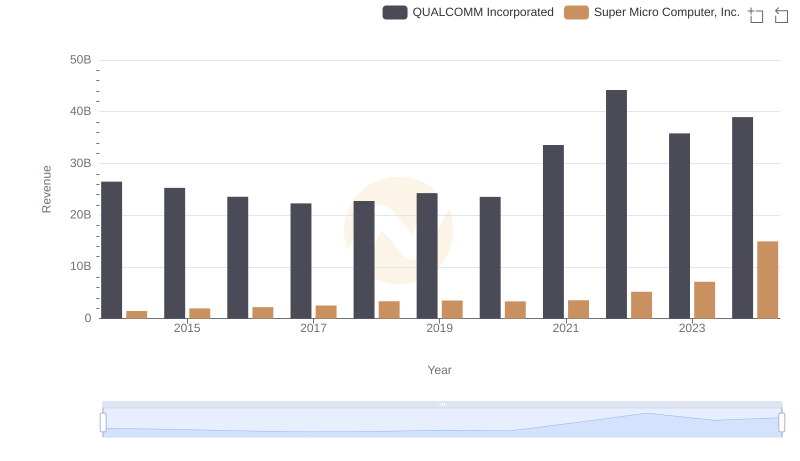
Revenue Insights: QUALCOMM Incorporated and Super Micro Computer, Inc. Performance Compared

Comparing Revenue Performance: QUALCOMM Incorporated or Guidewire Software, Inc.?
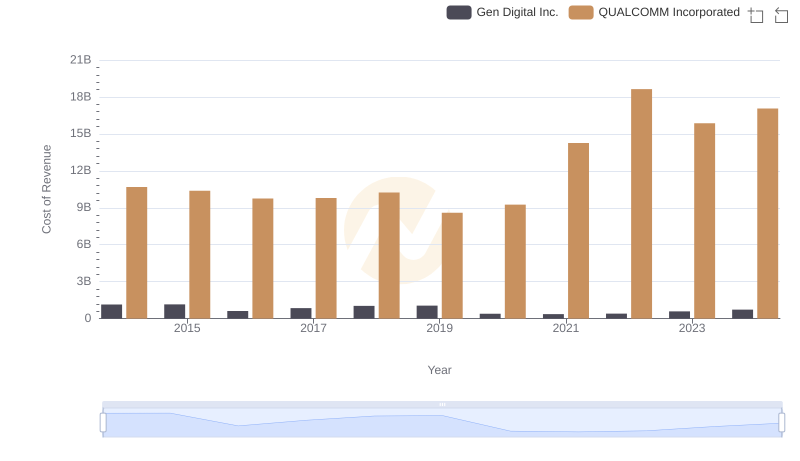
Cost of Revenue Comparison: QUALCOMM Incorporated vs Gen Digital Inc.
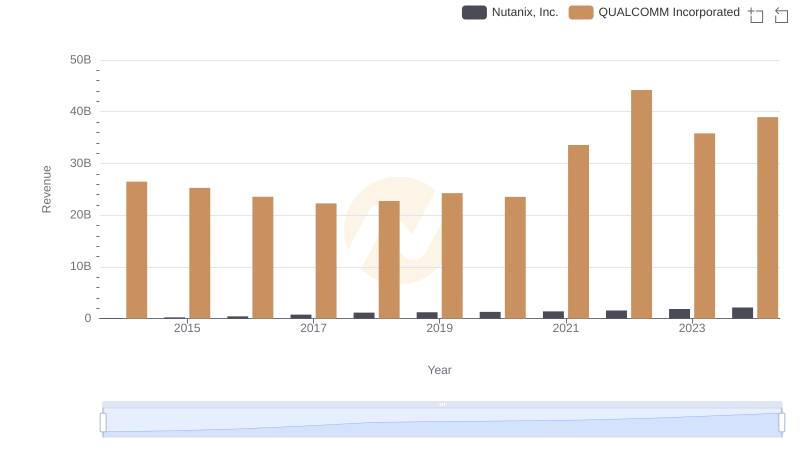
QUALCOMM Incorporated or Nutanix, Inc.: Who Leads in Yearly Revenue?
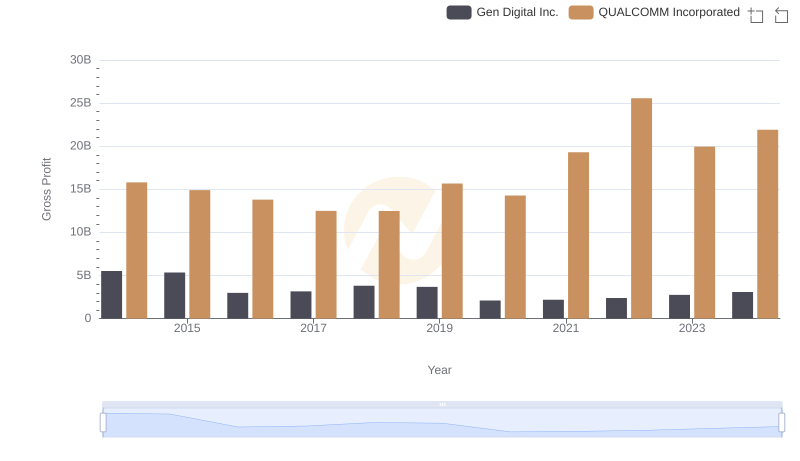
Key Insights on Gross Profit: QUALCOMM Incorporated vs Gen Digital Inc.
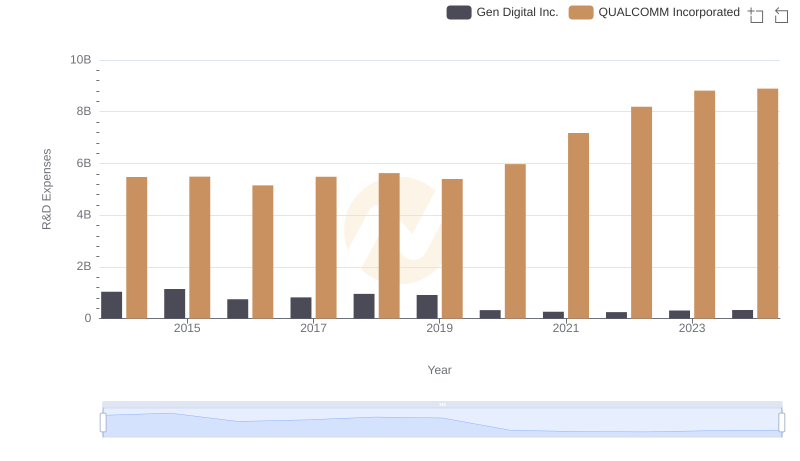
Research and Development Expenses Breakdown: QUALCOMM Incorporated vs Gen Digital Inc.
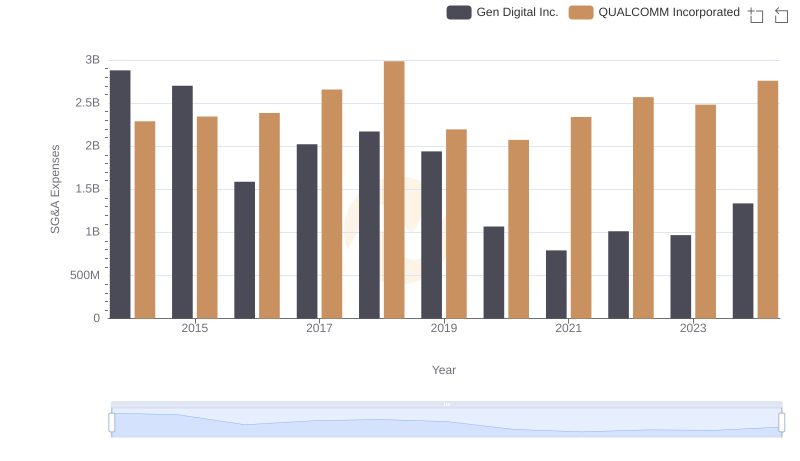
Comparing SG&A Expenses: QUALCOMM Incorporated vs Gen Digital Inc. Trends and Insights
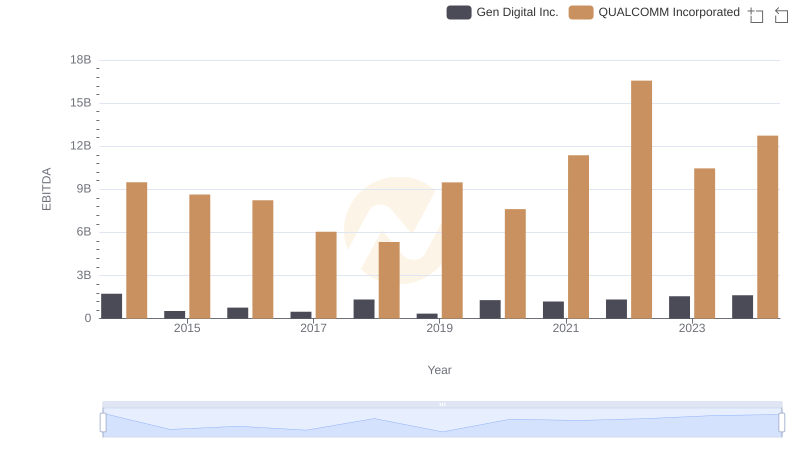
A Professional Review of EBITDA: QUALCOMM Incorporated Compared to Gen Digital Inc.