| __timestamp | Gen Digital Inc. | QUALCOMM Incorporated |
|---|---|---|
| Wednesday, January 1, 2014 | 1149000000 | 10686000000 |
| Thursday, January 1, 2015 | 1153000000 | 10378000000 |
| Friday, January 1, 2016 | 615000000 | 9749000000 |
| Sunday, January 1, 2017 | 853000000 | 9792000000 |
| Monday, January 1, 2018 | 1032000000 | 10244000000 |
| Tuesday, January 1, 2019 | 1050000000 | 8599000000 |
| Wednesday, January 1, 2020 | 393000000 | 9255000000 |
| Friday, January 1, 2021 | 362000000 | 14262000000 |
| Saturday, January 1, 2022 | 408000000 | 18635000000 |
| Sunday, January 1, 2023 | 589000000 | 15869000000 |
| Monday, January 1, 2024 | 731000000 | 17060000000 |
Unveiling the hidden dimensions of data
In the ever-evolving tech industry, understanding cost structures is crucial for investors and analysts alike. Over the past decade, QUALCOMM Incorporated and Gen Digital Inc. have showcased contrasting cost of revenue trends. From 2014 to 2024, QUALCOMM's cost of revenue has surged by approximately 60%, peaking in 2022 with a staggering $18.6 billion. This reflects its expansive growth and increased production capabilities. In contrast, Gen Digital's cost of revenue has seen a more modest fluctuation, with a notable dip in 2020 to $393 million, likely due to strategic cost management or market shifts. By 2024, Gen Digital's costs rebounded to $731 million, indicating a recovery phase. This comparison highlights QUALCOMM's aggressive market expansion versus Gen Digital's more conservative approach. Such insights are invaluable for stakeholders aiming to navigate the competitive landscape of the tech sector.
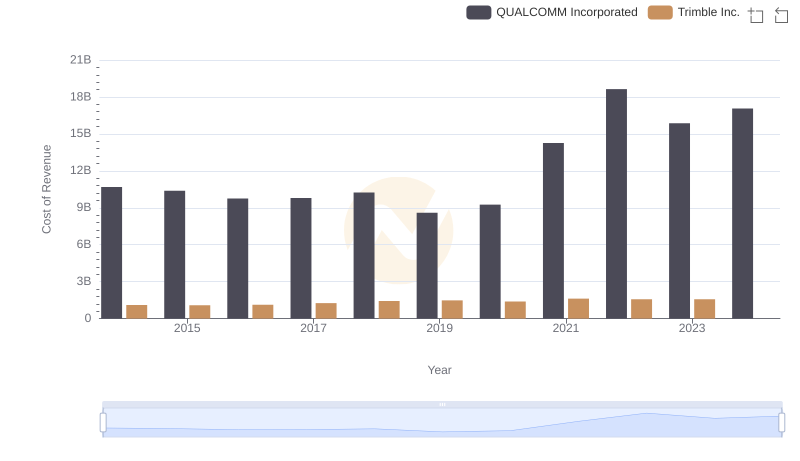
Comparing Cost of Revenue Efficiency: QUALCOMM Incorporated vs Trimble Inc.
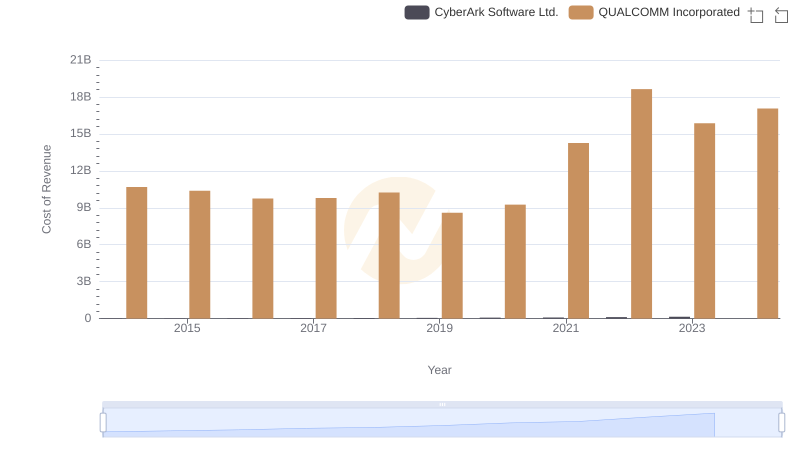
Cost of Revenue: Key Insights for QUALCOMM Incorporated and CyberArk Software Ltd.
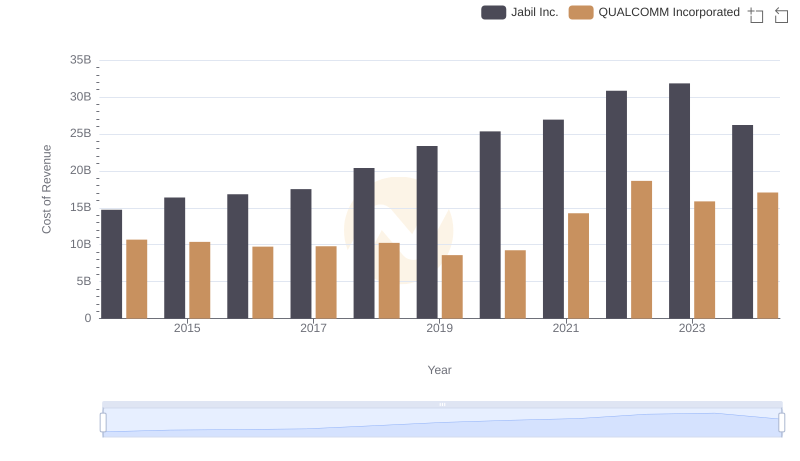
Cost of Revenue Comparison: QUALCOMM Incorporated vs Jabil Inc.
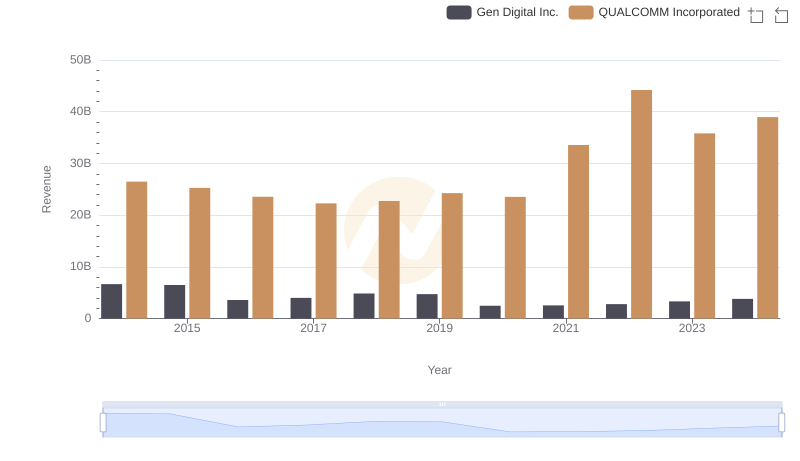
QUALCOMM Incorporated and Gen Digital Inc.: A Comprehensive Revenue Analysis

Cost Insights: Breaking Down QUALCOMM Incorporated and Manhattan Associates, Inc.'s Expenses
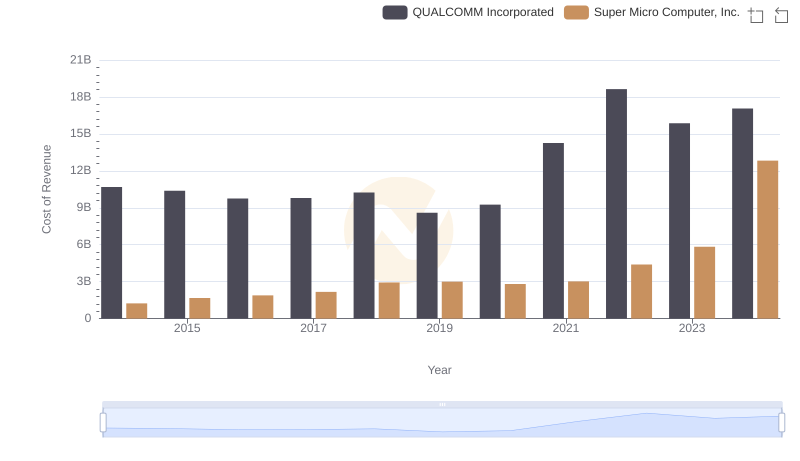
Cost of Revenue: Key Insights for QUALCOMM Incorporated and Super Micro Computer, Inc.
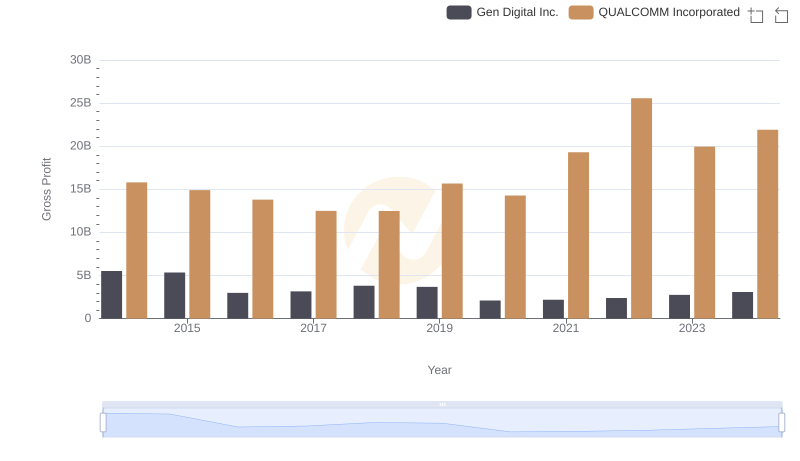
Key Insights on Gross Profit: QUALCOMM Incorporated vs Gen Digital Inc.
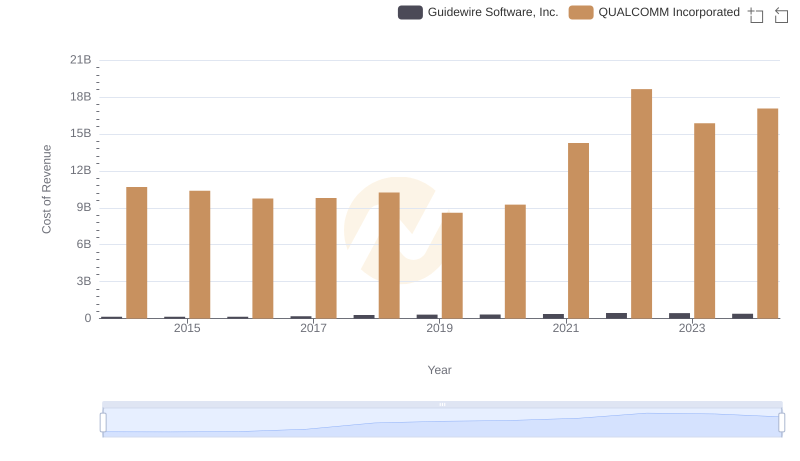
Cost of Revenue Trends: QUALCOMM Incorporated vs Guidewire Software, Inc.
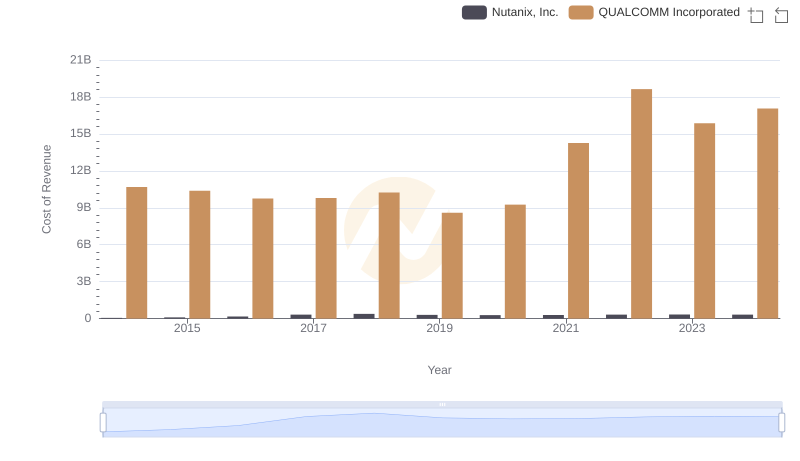
Cost of Revenue Comparison: QUALCOMM Incorporated vs Nutanix, Inc.
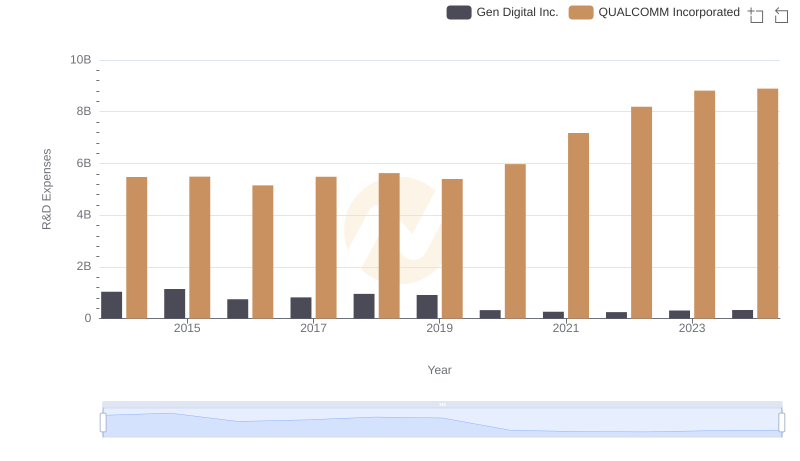
Research and Development Expenses Breakdown: QUALCOMM Incorporated vs Gen Digital Inc.
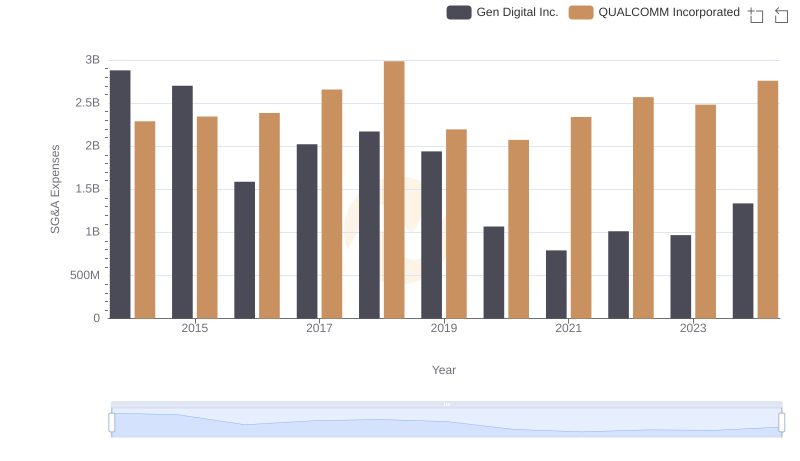
Comparing SG&A Expenses: QUALCOMM Incorporated vs Gen Digital Inc. Trends and Insights
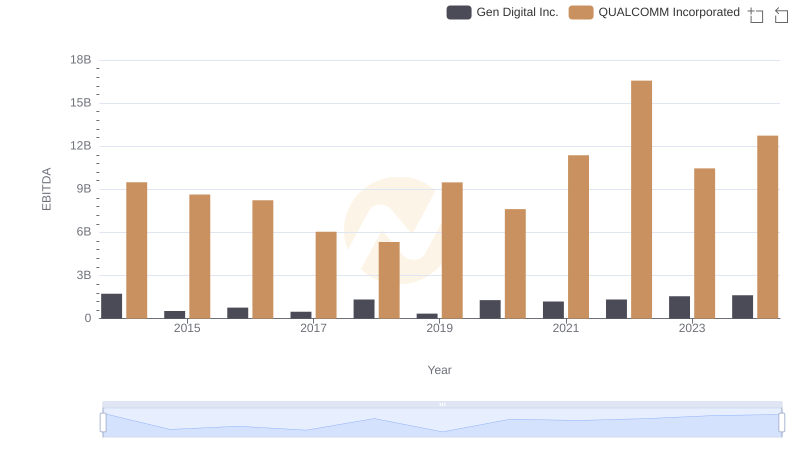
A Professional Review of EBITDA: QUALCOMM Incorporated Compared to Gen Digital Inc.