| __timestamp | CyberArk Software Ltd. | QUALCOMM Incorporated |
|---|---|---|
| Wednesday, January 1, 2014 | 53438000 | 2290000000 |
| Thursday, January 1, 2015 | 83196000 | 2344000000 |
| Friday, January 1, 2016 | 115892000 | 2385000000 |
| Sunday, January 1, 2017 | 157138000 | 2658000000 |
| Monday, January 1, 2018 | 190334000 | 2986000000 |
| Tuesday, January 1, 2019 | 236476000 | 2195000000 |
| Wednesday, January 1, 2020 | 280428000 | 2074000000 |
| Friday, January 1, 2021 | 345826000 | 2339000000 |
| Saturday, January 1, 2022 | 427793000 | 2570000000 |
| Sunday, January 1, 2023 | 500784000 | 2483000000 |
| Monday, January 1, 2024 | 593210000 | 2759000000 |
Unlocking the unknown
In the ever-evolving tech industry, operational efficiency is key to maintaining a competitive edge. This analysis delves into the Selling, General, and Administrative (SG&A) expenses of two tech giants: QUALCOMM Incorporated and CyberArk Software Ltd., from 2014 to 2023.
QUALCOMM, a leader in wireless technology, consistently reported SG&A expenses averaging around $2.46 billion annually. Notably, their expenses peaked in 2018, reaching nearly $3 billion, before stabilizing in subsequent years. In contrast, CyberArk, a cybersecurity firm, exhibited a steady upward trend in SG&A expenses, growing from approximately $53 million in 2014 to over $500 million by 2023, marking a staggering 840% increase.
This divergence highlights the distinct growth trajectories and strategic investments of these companies. While QUALCOMM maintains a robust operational scale, CyberArk's rising expenses reflect its aggressive expansion in the cybersecurity domain.
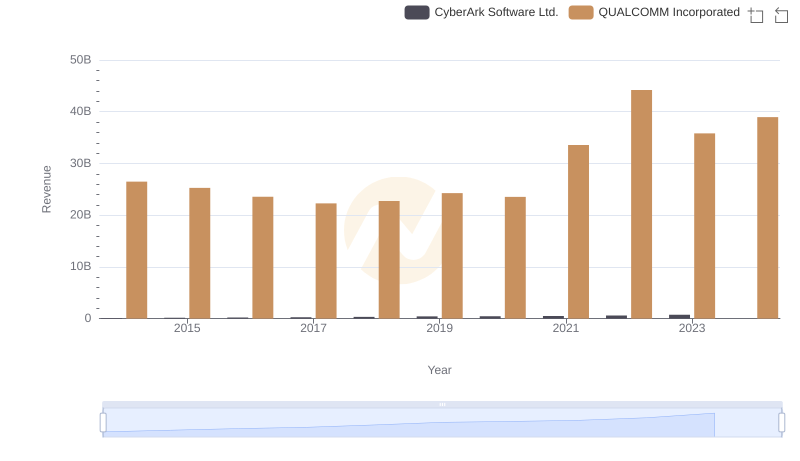
QUALCOMM Incorporated vs CyberArk Software Ltd.: Annual Revenue Growth Compared
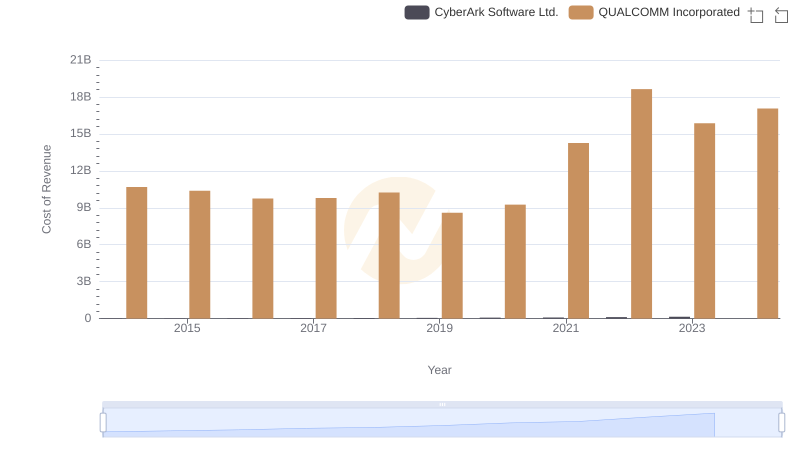
Cost of Revenue: Key Insights for QUALCOMM Incorporated and CyberArk Software Ltd.
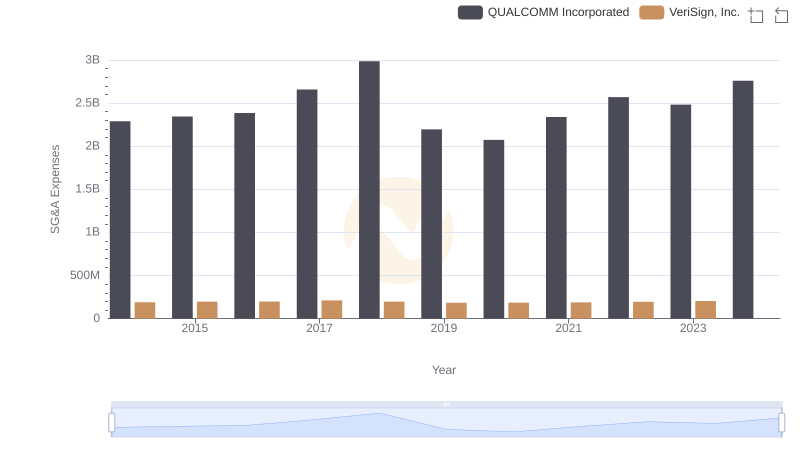
Operational Costs Compared: SG&A Analysis of QUALCOMM Incorporated and VeriSign, Inc.
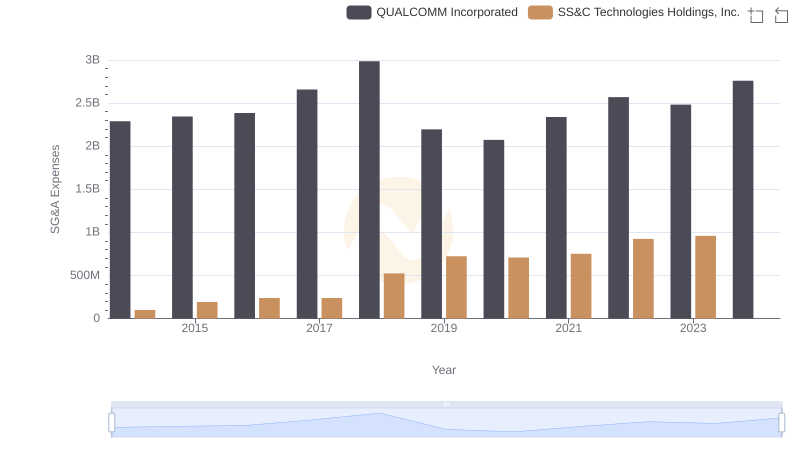
Breaking Down SG&A Expenses: QUALCOMM Incorporated vs SS&C Technologies Holdings, Inc.
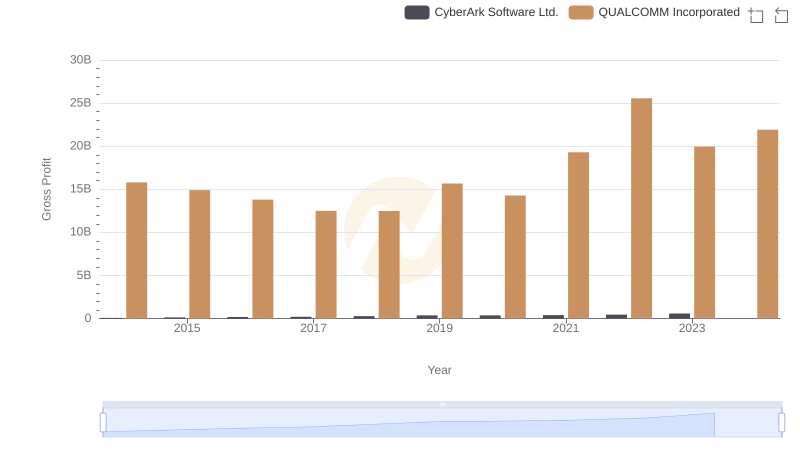
Key Insights on Gross Profit: QUALCOMM Incorporated vs CyberArk Software Ltd.
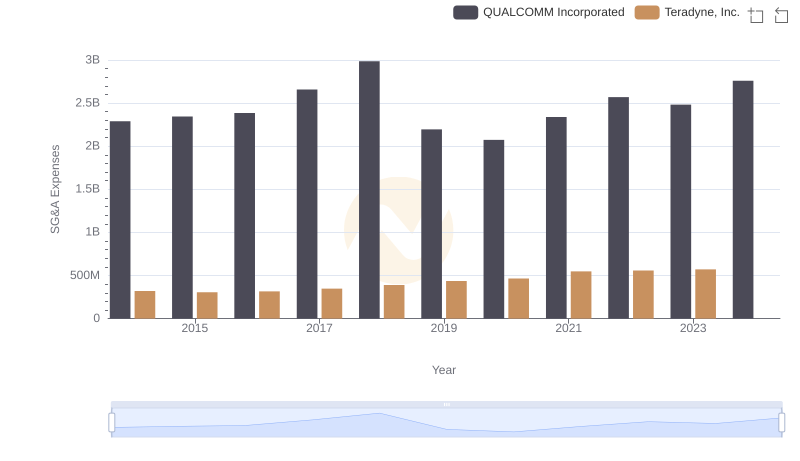
Selling, General, and Administrative Costs: QUALCOMM Incorporated vs Teradyne, Inc.
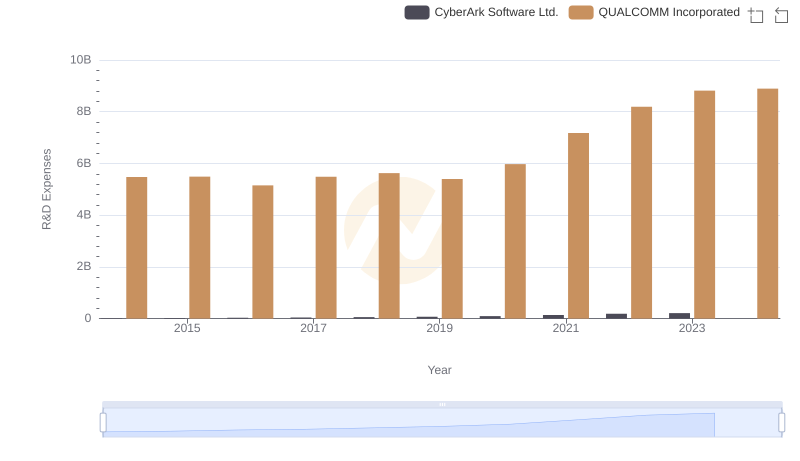
Comparing Innovation Spending: QUALCOMM Incorporated and CyberArk Software Ltd.
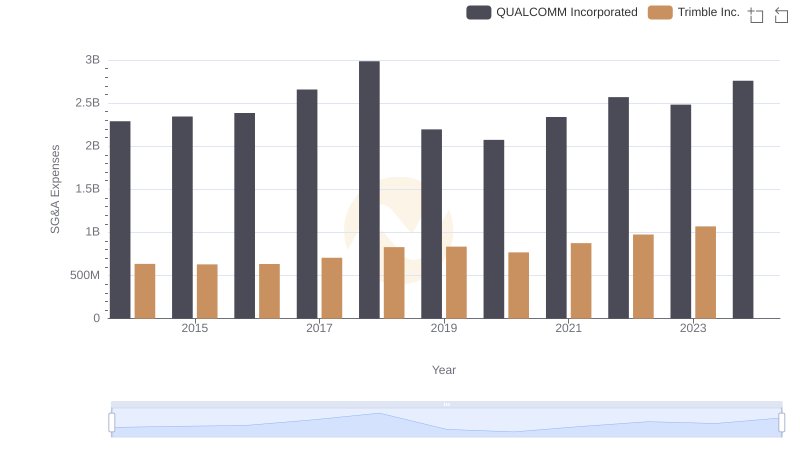
Who Optimizes SG&A Costs Better? QUALCOMM Incorporated or Trimble Inc.
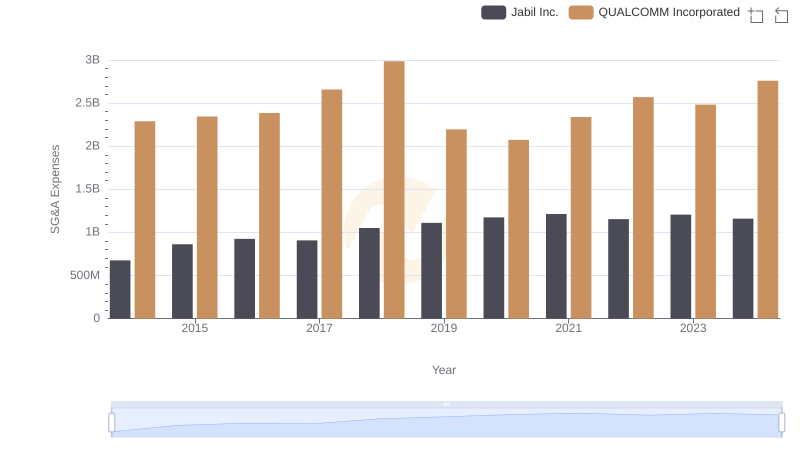
QUALCOMM Incorporated or Jabil Inc.: Who Manages SG&A Costs Better?
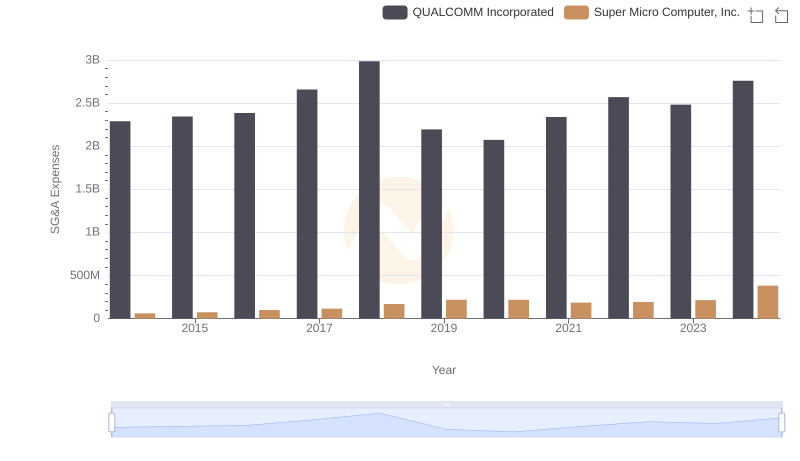
QUALCOMM Incorporated and Super Micro Computer, Inc.: SG&A Spending Patterns Compared
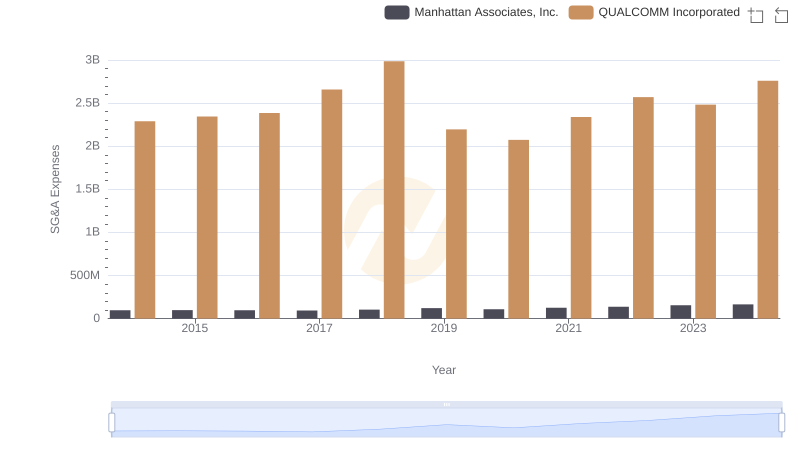
Breaking Down SG&A Expenses: QUALCOMM Incorporated vs Manhattan Associates, Inc.
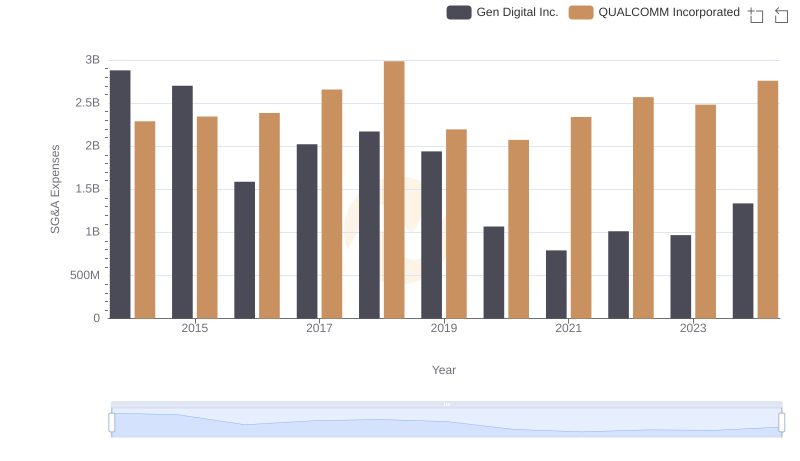
Comparing SG&A Expenses: QUALCOMM Incorporated vs Gen Digital Inc. Trends and Insights