| __timestamp | Nutanix, Inc. | QUALCOMM Incorporated |
|---|---|---|
| Wednesday, January 1, 2014 | 106497000 | 2290000000 |
| Thursday, January 1, 2015 | 185728000 | 2344000000 |
| Friday, January 1, 2016 | 322758000 | 2385000000 |
| Sunday, January 1, 2017 | 577870000 | 2658000000 |
| Monday, January 1, 2018 | 736058000 | 2986000000 |
| Tuesday, January 1, 2019 | 1029337000 | 2195000000 |
| Wednesday, January 1, 2020 | 1295936000 | 2074000000 |
| Friday, January 1, 2021 | 1206290000 | 2339000000 |
| Saturday, January 1, 2022 | 1145122000 | 2570000000 |
| Sunday, January 1, 2023 | 1156897000 | 2483000000 |
| Monday, January 1, 2024 | 1178149000 | 2759000000 |
Unlocking the unknown
In the ever-evolving tech landscape, understanding a company's operational efficiency is crucial. Selling, General, and Administrative (SG&A) expenses offer a window into this efficiency. Over the past decade, Nutanix, Inc. and QUALCOMM Incorporated have showcased contrasting trends in their SG&A expenditures.
From 2014 to 2024, Nutanix's SG&A expenses surged by over 1,000%, reflecting its aggressive growth strategy. In contrast, QUALCOMM's expenses remained relatively stable, with a modest increase of around 20%. This stability underscores QUALCOMM's mature market position and efficient cost management.
By 2024, Nutanix's SG&A expenses reached approximately 42% of QUALCOMM's, up from just 5% in 2014. This shift highlights Nutanix's rapid expansion and increasing market footprint. As these companies continue to evolve, their SG&A strategies will be pivotal in shaping their competitive edge.
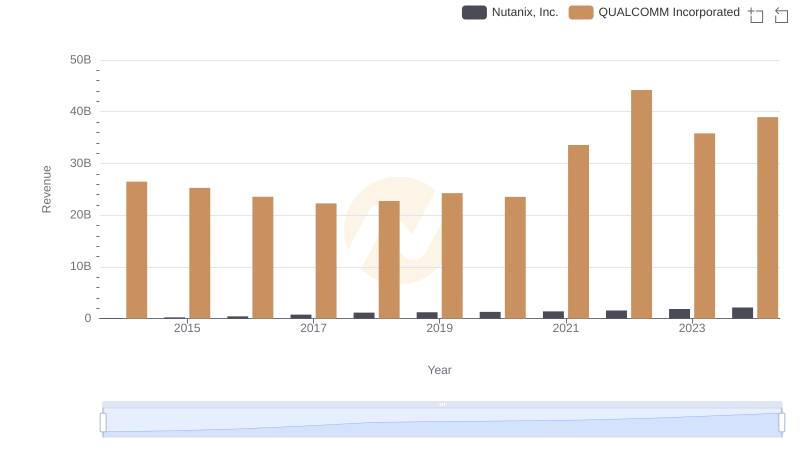
QUALCOMM Incorporated or Nutanix, Inc.: Who Leads in Yearly Revenue?
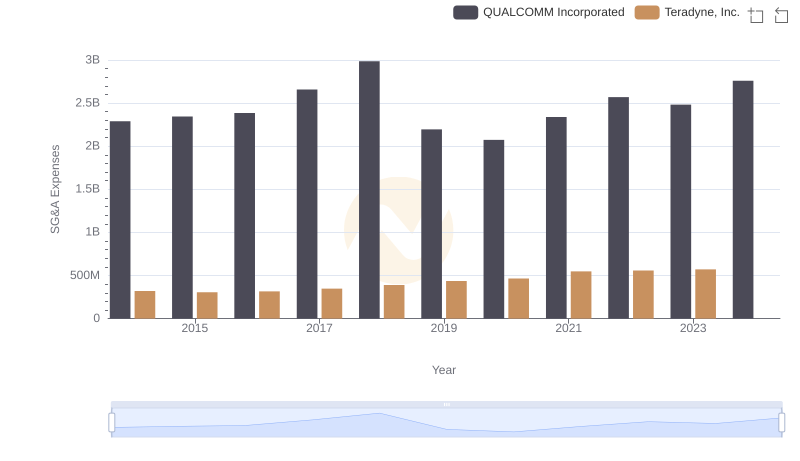
Selling, General, and Administrative Costs: QUALCOMM Incorporated vs Teradyne, Inc.
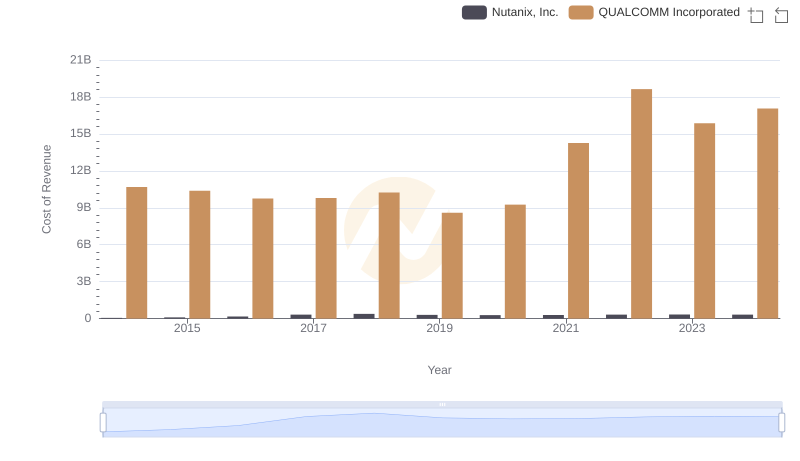
Cost of Revenue Comparison: QUALCOMM Incorporated vs Nutanix, Inc.
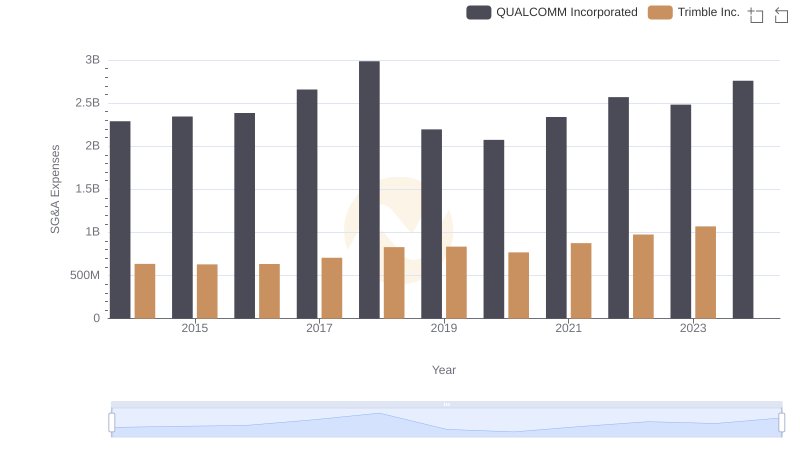
Who Optimizes SG&A Costs Better? QUALCOMM Incorporated or Trimble Inc.
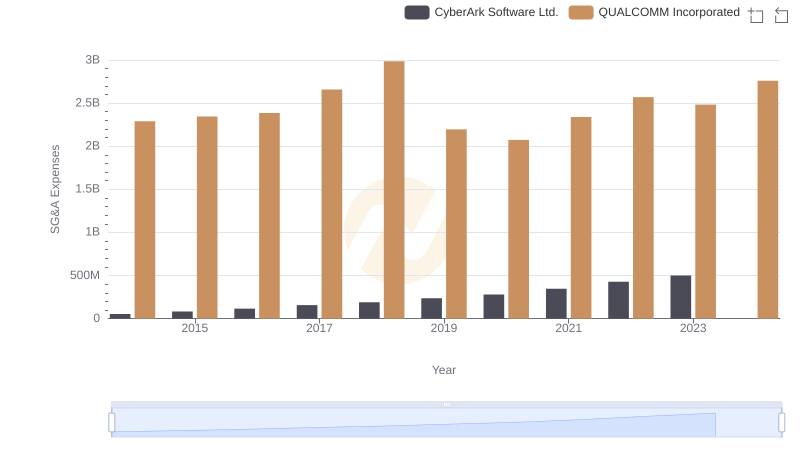
Operational Costs Compared: SG&A Analysis of QUALCOMM Incorporated and CyberArk Software Ltd.
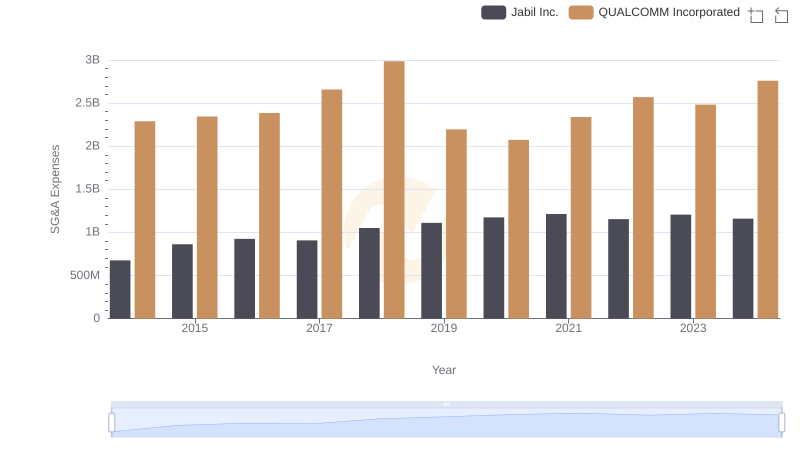
QUALCOMM Incorporated or Jabil Inc.: Who Manages SG&A Costs Better?
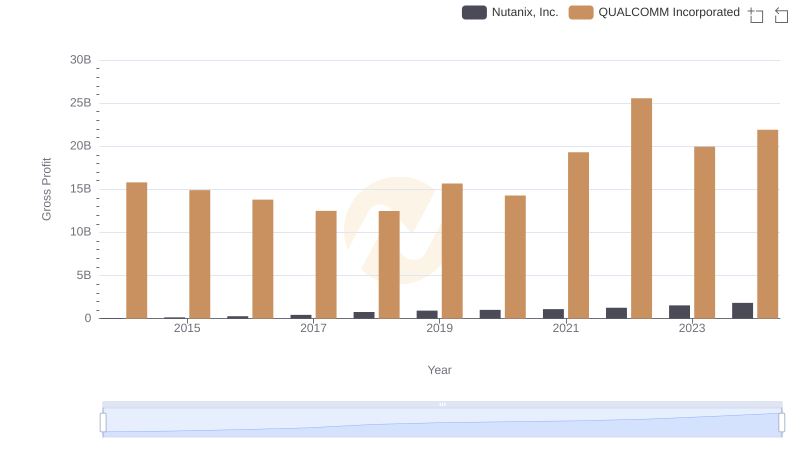
Gross Profit Trends Compared: QUALCOMM Incorporated vs Nutanix, Inc.
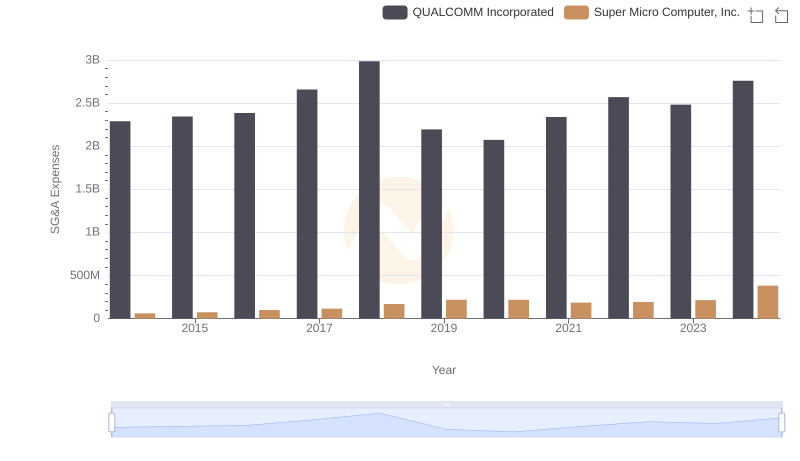
QUALCOMM Incorporated and Super Micro Computer, Inc.: SG&A Spending Patterns Compared
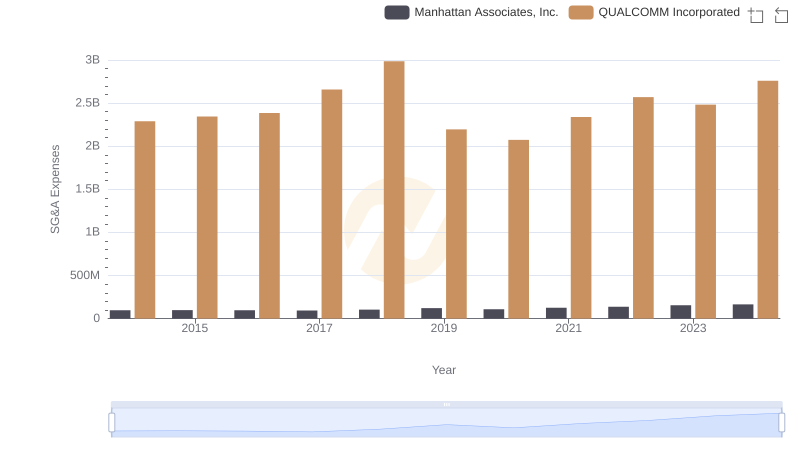
Breaking Down SG&A Expenses: QUALCOMM Incorporated vs Manhattan Associates, Inc.
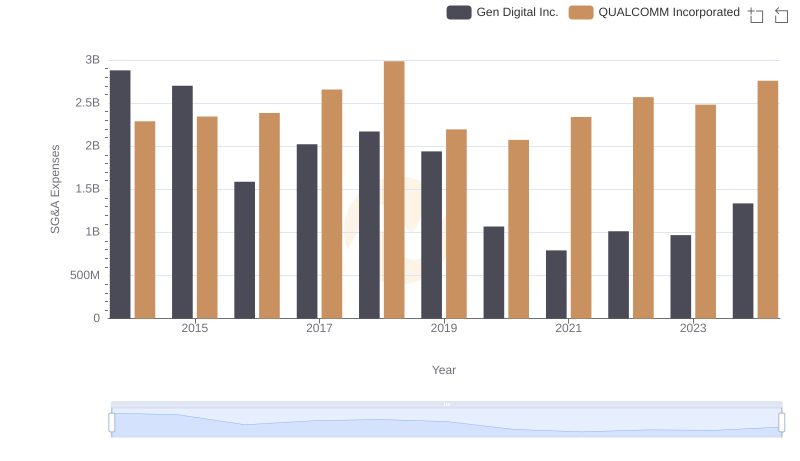
Comparing SG&A Expenses: QUALCOMM Incorporated vs Gen Digital Inc. Trends and Insights
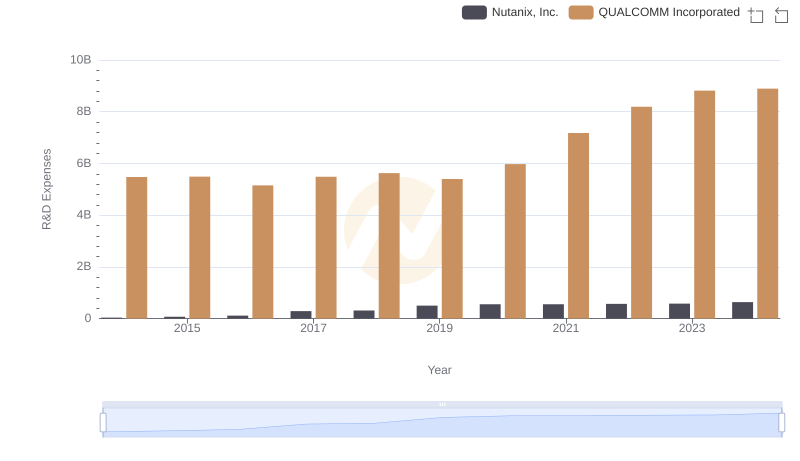
QUALCOMM Incorporated vs Nutanix, Inc.: Strategic Focus on R&D Spending
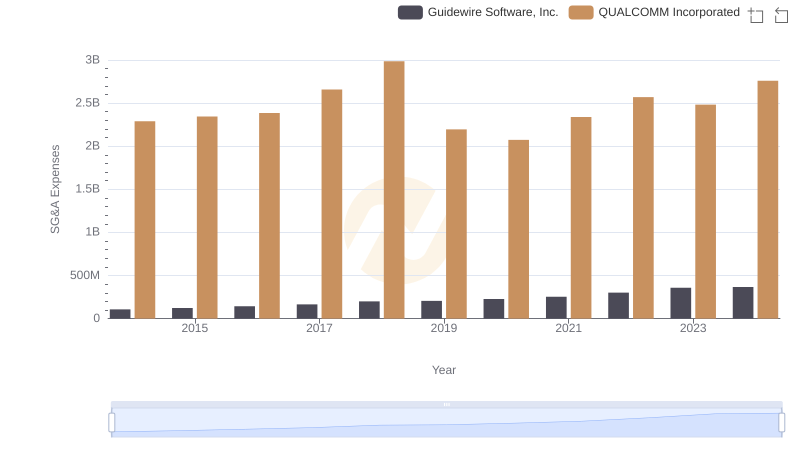
QUALCOMM Incorporated or Guidewire Software, Inc.: Who Manages SG&A Costs Better?