| __timestamp | Manhattan Associates, Inc. | QUALCOMM Incorporated |
|---|---|---|
| Wednesday, January 1, 2014 | 97072000 | 2290000000 |
| Thursday, January 1, 2015 | 97874000 | 2344000000 |
| Friday, January 1, 2016 | 96545000 | 2385000000 |
| Sunday, January 1, 2017 | 93536000 | 2658000000 |
| Monday, January 1, 2018 | 103880000 | 2986000000 |
| Tuesday, January 1, 2019 | 121463000 | 2195000000 |
| Wednesday, January 1, 2020 | 109202000 | 2074000000 |
| Friday, January 1, 2021 | 125941000 | 2339000000 |
| Saturday, January 1, 2022 | 137607000 | 2570000000 |
| Sunday, January 1, 2023 | 155664000 | 2483000000 |
| Monday, January 1, 2024 | 165786000 | 2759000000 |
In pursuit of knowledge
In the ever-evolving landscape of corporate finance, understanding the nuances of Selling, General, and Administrative (SG&A) expenses is crucial. Over the past decade, from 2014 to 2024, QUALCOMM Incorporated and Manhattan Associates, Inc. have demonstrated distinct financial strategies. QUALCOMM, a leader in the semiconductor industry, consistently reported SG&A expenses that were approximately 20 times higher than those of Manhattan Associates, a supply chain solutions provider. This disparity highlights QUALCOMM's expansive operational scale and global reach.
Interestingly, both companies have shown a steady increase in their SG&A expenses over the years. Manhattan Associates saw a 77% rise from 2014 to 2024, reflecting its strategic investments in growth and innovation. Meanwhile, QUALCOMM's expenses fluctuated, peaking in 2018, before stabilizing. This analysis underscores the diverse financial strategies employed by these industry giants, offering valuable insights into their operational priorities.
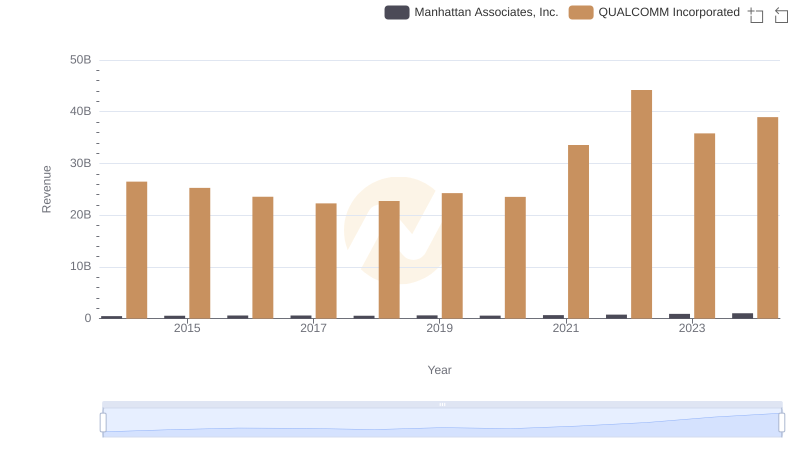
Who Generates More Revenue? QUALCOMM Incorporated or Manhattan Associates, Inc.
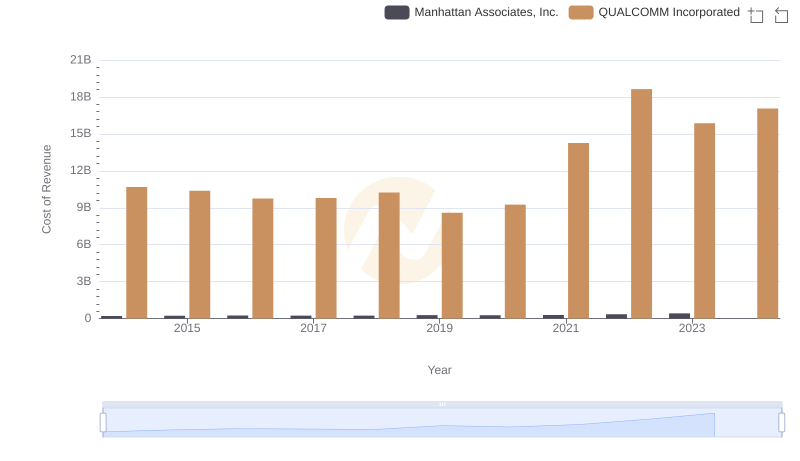
Cost Insights: Breaking Down QUALCOMM Incorporated and Manhattan Associates, Inc.'s Expenses
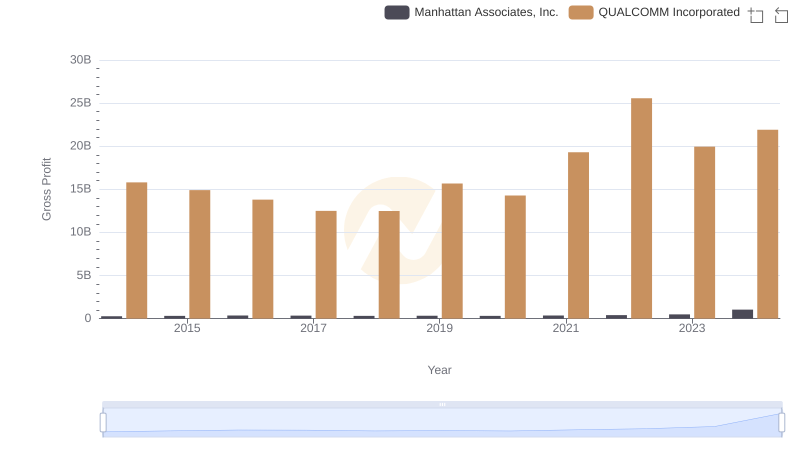
Gross Profit Analysis: Comparing QUALCOMM Incorporated and Manhattan Associates, Inc.
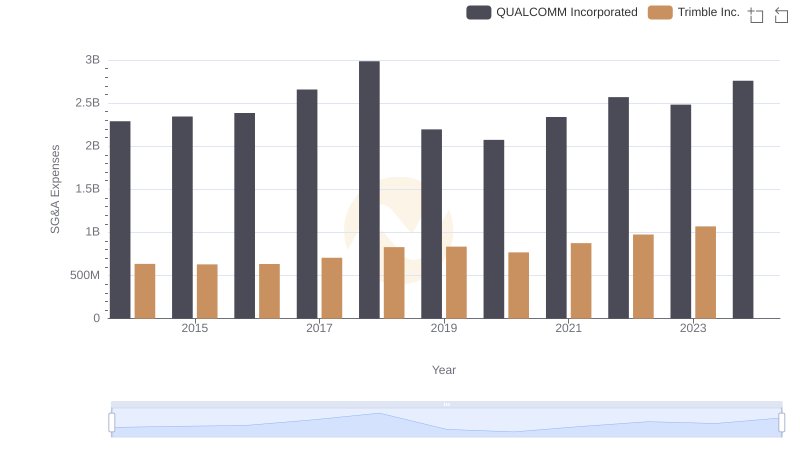
Who Optimizes SG&A Costs Better? QUALCOMM Incorporated or Trimble Inc.
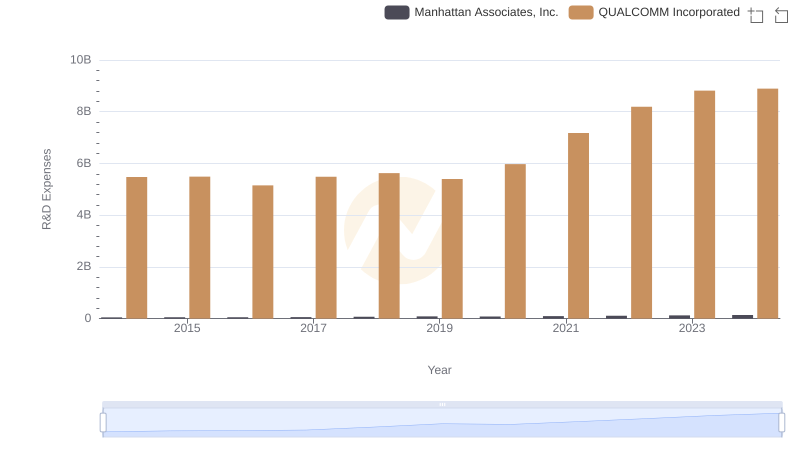
Analyzing R&D Budgets: QUALCOMM Incorporated vs Manhattan Associates, Inc.
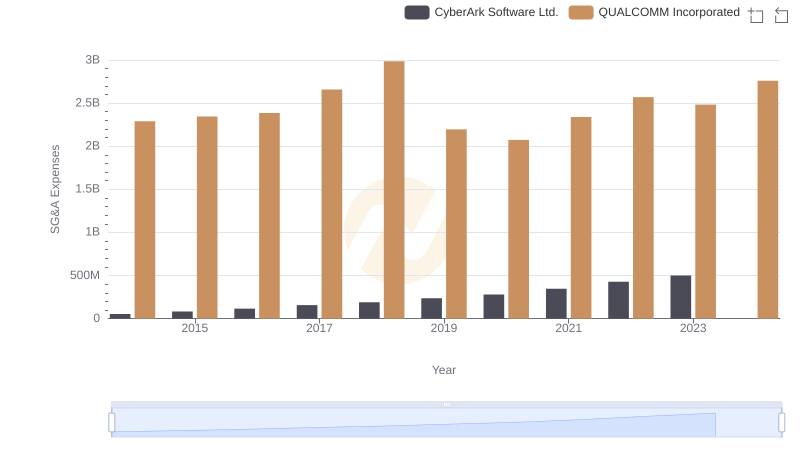
Operational Costs Compared: SG&A Analysis of QUALCOMM Incorporated and CyberArk Software Ltd.
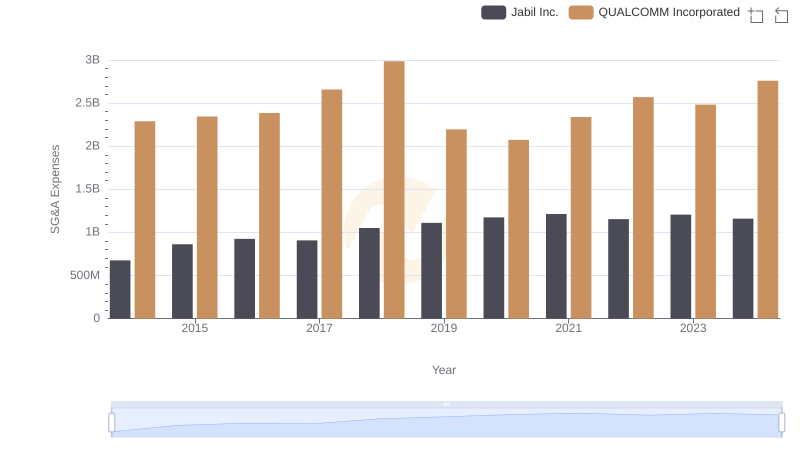
QUALCOMM Incorporated or Jabil Inc.: Who Manages SG&A Costs Better?
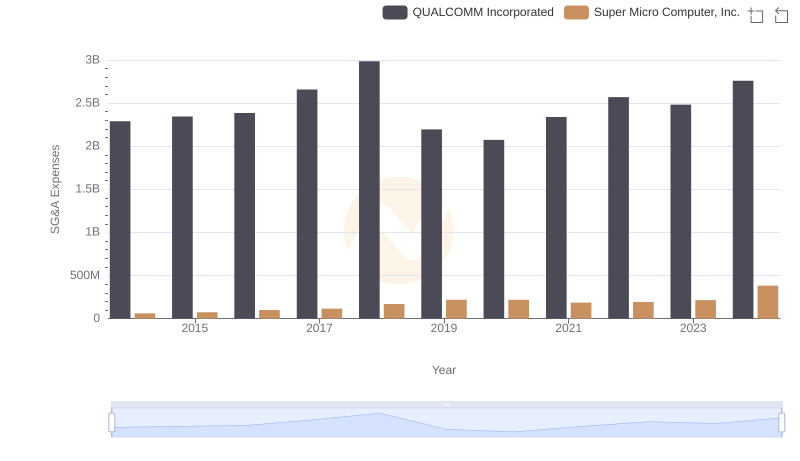
QUALCOMM Incorporated and Super Micro Computer, Inc.: SG&A Spending Patterns Compared
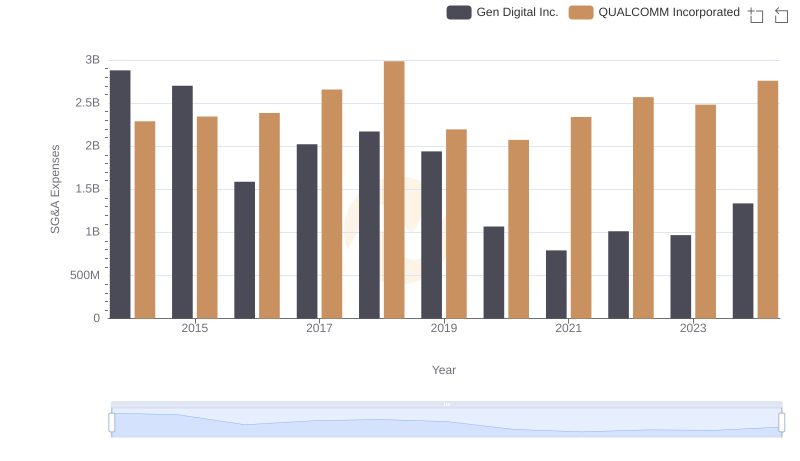
Comparing SG&A Expenses: QUALCOMM Incorporated vs Gen Digital Inc. Trends and Insights
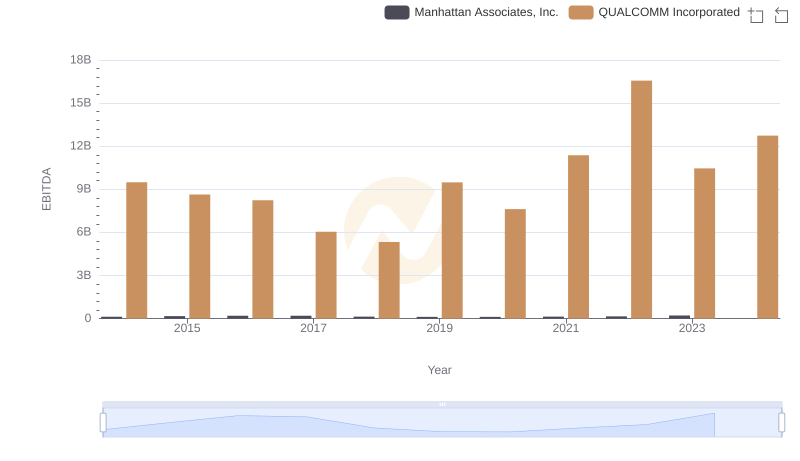
Comprehensive EBITDA Comparison: QUALCOMM Incorporated vs Manhattan Associates, Inc.
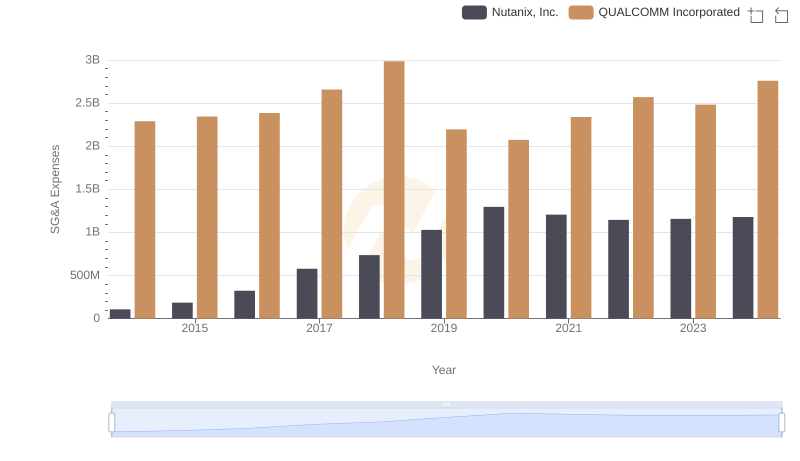
SG&A Efficiency Analysis: Comparing QUALCOMM Incorporated and Nutanix, Inc.
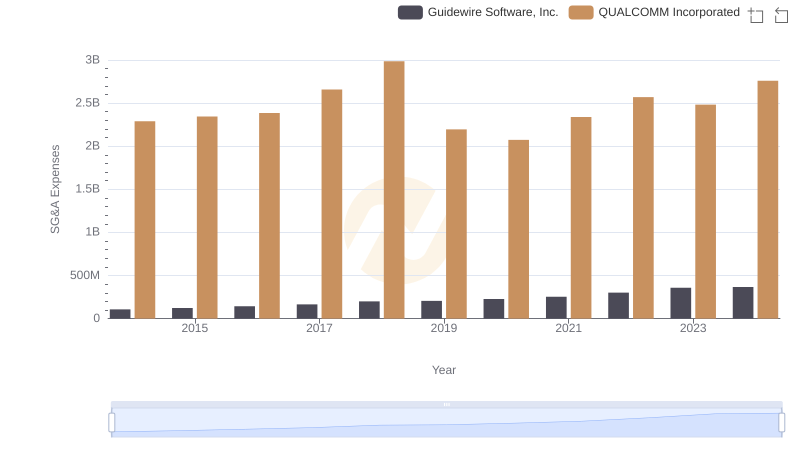
QUALCOMM Incorporated or Guidewire Software, Inc.: Who Manages SG&A Costs Better?