| __timestamp | Gen Digital Inc. | QUALCOMM Incorporated |
|---|---|---|
| Wednesday, January 1, 2014 | 5527000000 | 15801000000 |
| Thursday, January 1, 2015 | 5355000000 | 14903000000 |
| Friday, January 1, 2016 | 2985000000 | 13805000000 |
| Sunday, January 1, 2017 | 3166000000 | 12499000000 |
| Monday, January 1, 2018 | 3814000000 | 12488000000 |
| Tuesday, January 1, 2019 | 3681000000 | 15674000000 |
| Wednesday, January 1, 2020 | 2097000000 | 14276000000 |
| Friday, January 1, 2021 | 2189000000 | 19304000000 |
| Saturday, January 1, 2022 | 2388000000 | 25565000000 |
| Sunday, January 1, 2023 | 2749000000 | 19951000000 |
| Monday, January 1, 2024 | 3081000000 | 21902000000 |
Data in motion
In the ever-evolving landscape of technology, understanding financial performance is crucial. Over the past decade, QUALCOMM Incorporated has consistently outperformed Gen Digital Inc. in terms of gross profit. From 2014 to 2024, QUALCOMM's gross profit has shown a robust upward trend, peaking in 2022 with a staggering 25.6 billion dollars, marking a 62% increase from its 2014 figures. In contrast, Gen Digital's gross profit has experienced fluctuations, with a notable decline of 62% from 2014 to 2020, before rebounding to 3.1 billion dollars in 2024. This recovery highlights Gen Digital's resilience amidst market challenges. The data underscores QUALCOMM's dominant position in the industry, while Gen Digital's journey reflects the volatility and potential for growth in the tech sector. As we look to the future, these insights provide a valuable lens through which to view the financial health and strategic direction of these industry giants.
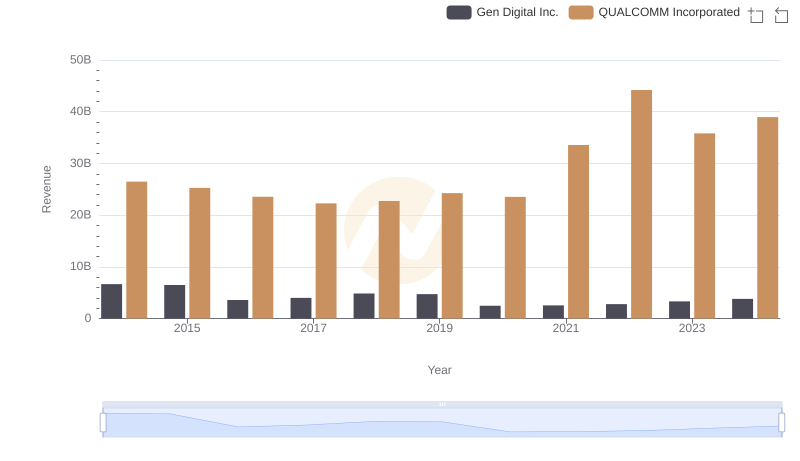
QUALCOMM Incorporated and Gen Digital Inc.: A Comprehensive Revenue Analysis
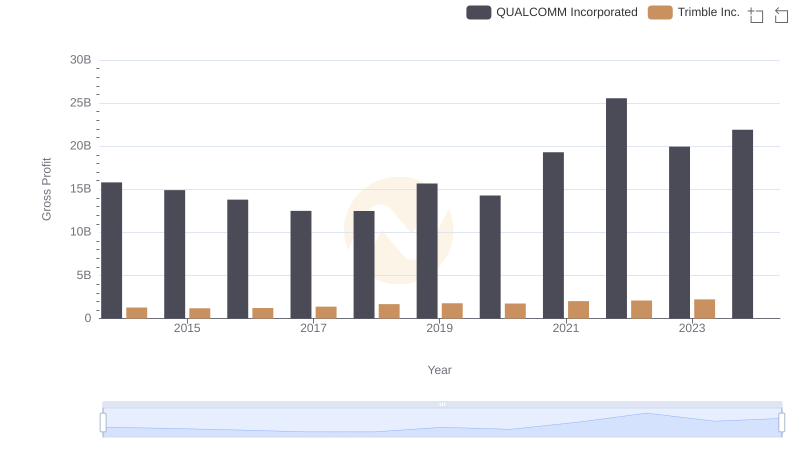
Gross Profit Trends Compared: QUALCOMM Incorporated vs Trimble Inc.
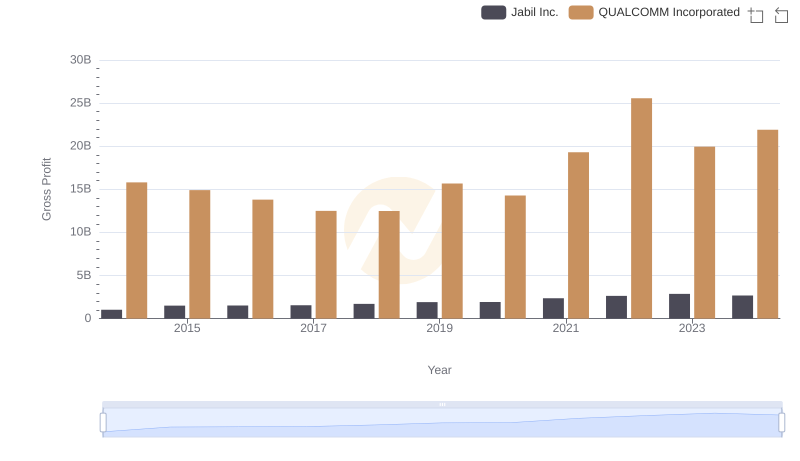
QUALCOMM Incorporated vs Jabil Inc.: A Gross Profit Performance Breakdown
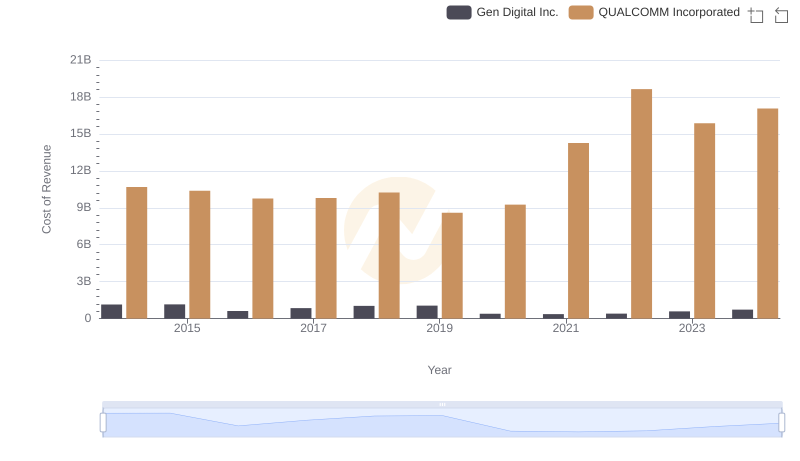
Cost of Revenue Comparison: QUALCOMM Incorporated vs Gen Digital Inc.
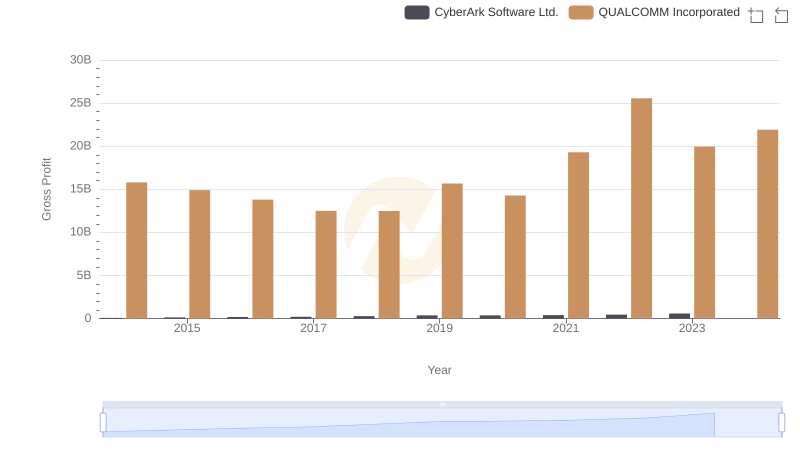
Key Insights on Gross Profit: QUALCOMM Incorporated vs CyberArk Software Ltd.
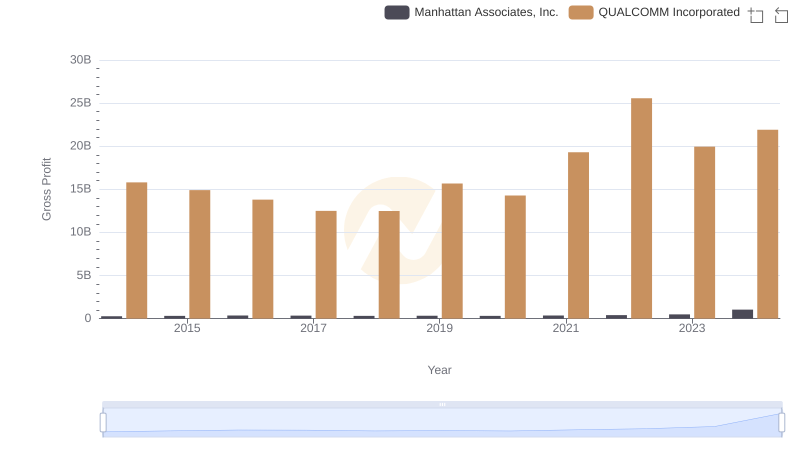
Gross Profit Analysis: Comparing QUALCOMM Incorporated and Manhattan Associates, Inc.
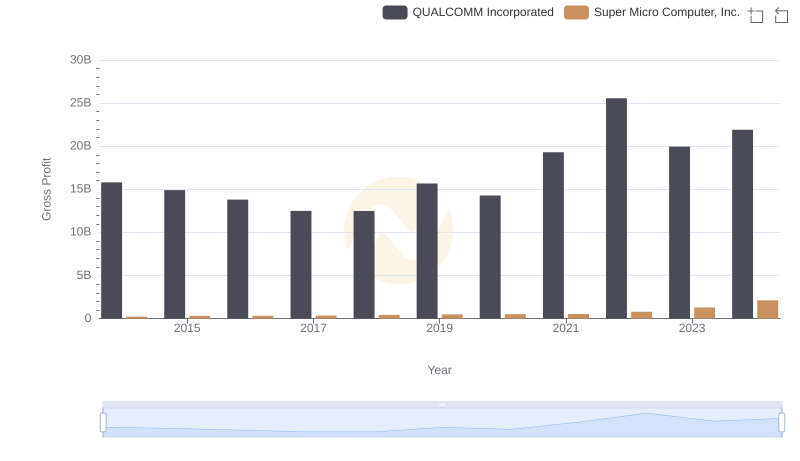
Gross Profit Trends Compared: QUALCOMM Incorporated vs Super Micro Computer, Inc.
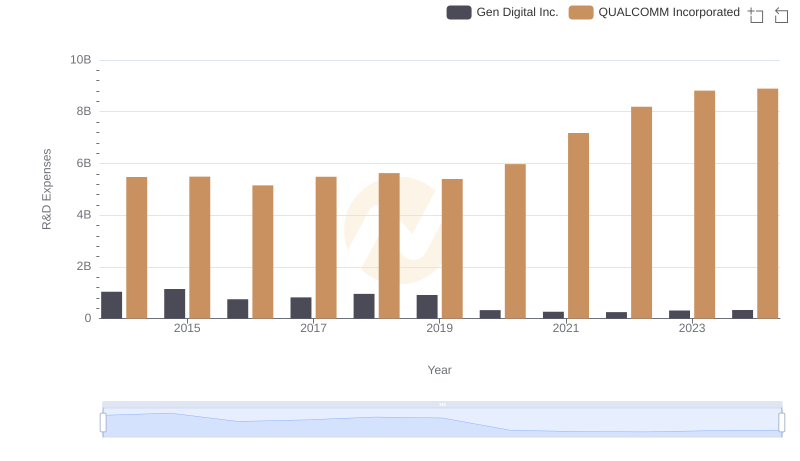
Research and Development Expenses Breakdown: QUALCOMM Incorporated vs Gen Digital Inc.
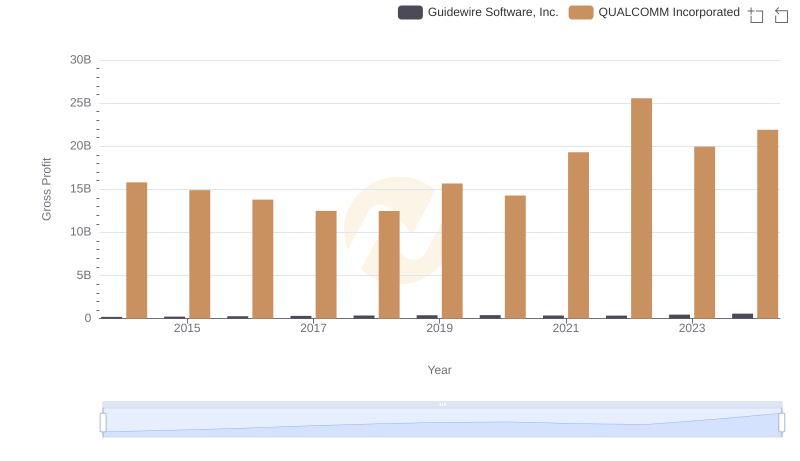
QUALCOMM Incorporated vs Guidewire Software, Inc.: A Gross Profit Performance Breakdown
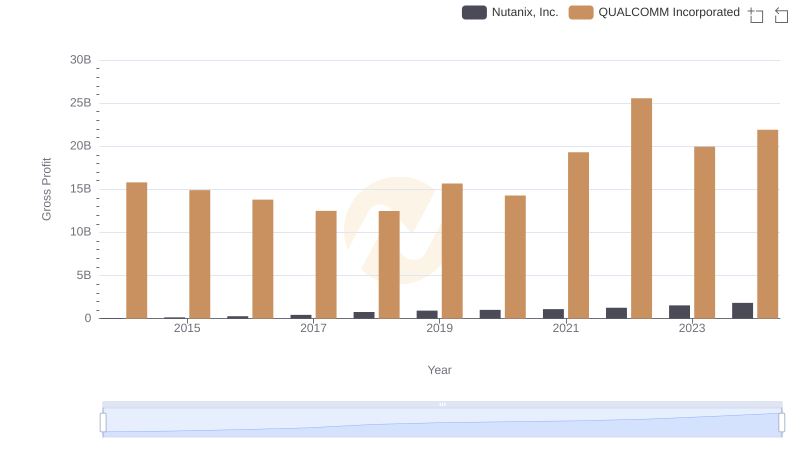
Gross Profit Trends Compared: QUALCOMM Incorporated vs Nutanix, Inc.
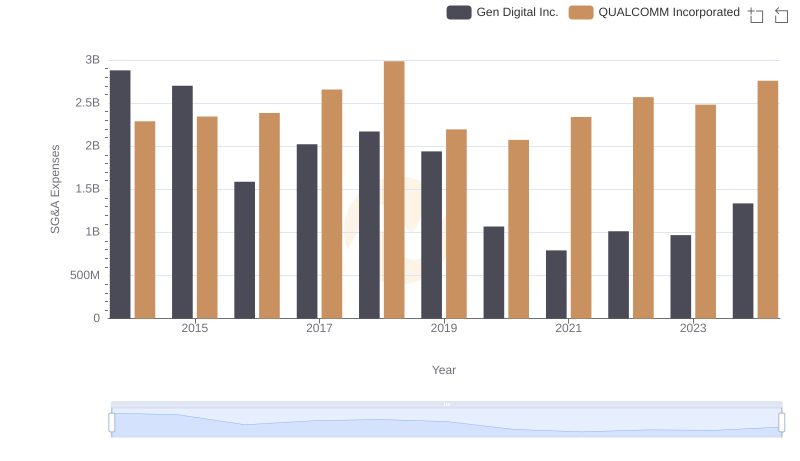
Comparing SG&A Expenses: QUALCOMM Incorporated vs Gen Digital Inc. Trends and Insights
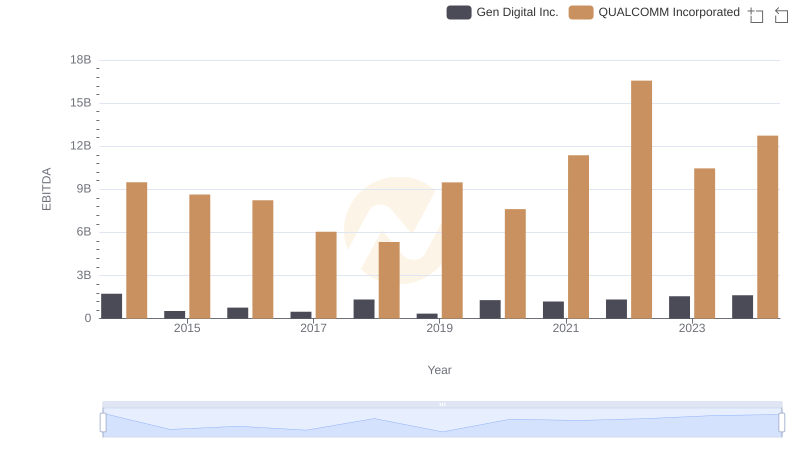
A Professional Review of EBITDA: QUALCOMM Incorporated Compared to Gen Digital Inc.