| __timestamp | AerCap Holdings N.V. | Equifax Inc. |
|---|---|---|
| Wednesday, January 1, 2014 | 2252878000 | 844700000 |
| Thursday, January 1, 2015 | 3776407000 | 887400000 |
| Friday, January 1, 2016 | 3465727000 | 1113400000 |
| Sunday, January 1, 2017 | 3377439000 | 1210700000 |
| Monday, January 1, 2018 | 3299635000 | 1440400000 |
| Tuesday, January 1, 2019 | 3259091000 | 1521700000 |
| Wednesday, January 1, 2020 | 3217133000 | 1737400000 |
| Friday, January 1, 2021 | 3287413000 | 1980900000 |
| Saturday, January 1, 2022 | 4805277000 | 2177200000 |
| Sunday, January 1, 2023 | 3237016000 | 2335100000 |
| Monday, January 1, 2024 | 0 |
Infusing magic into the data realm
In the ever-evolving landscape of global finance, understanding the cost of revenue is crucial for investors and analysts alike. This metric, which represents the direct costs attributable to the production of goods sold by a company, offers insights into operational efficiency and profitability.
From 2014 to 2023, AerCap Holdings N.V. and Equifax Inc. have shown distinct trends in their cost of revenue. AerCap Holdings N.V. experienced a notable peak in 2022, with costs surging by approximately 48% compared to 2014. Meanwhile, Equifax Inc. demonstrated a steady increase, with costs rising by around 176% over the same period. This growth reflects strategic investments and market expansion.
While AerCap's costs fluctuated, Equifax's consistent rise suggests a robust growth strategy. Investors should consider these trends when evaluating potential opportunities in these companies.
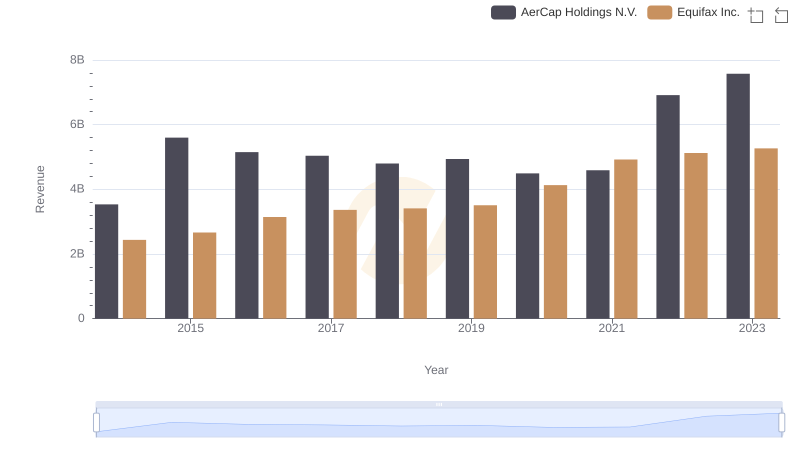
Revenue Showdown: Equifax Inc. vs AerCap Holdings N.V.
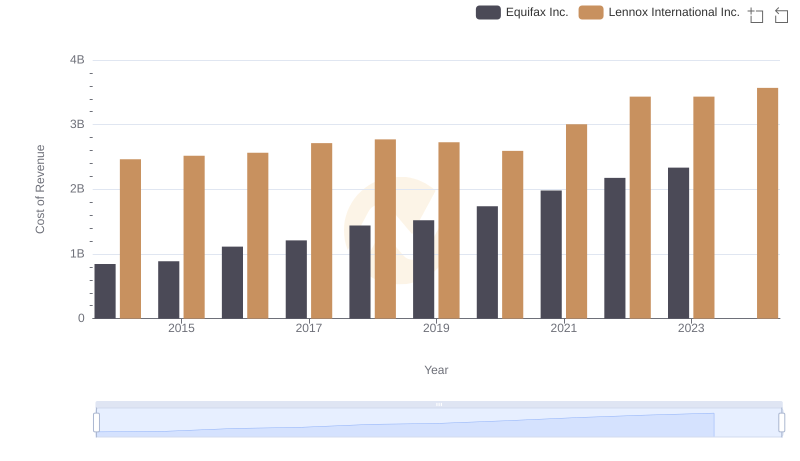
Cost of Revenue Comparison: Equifax Inc. vs Lennox International Inc.
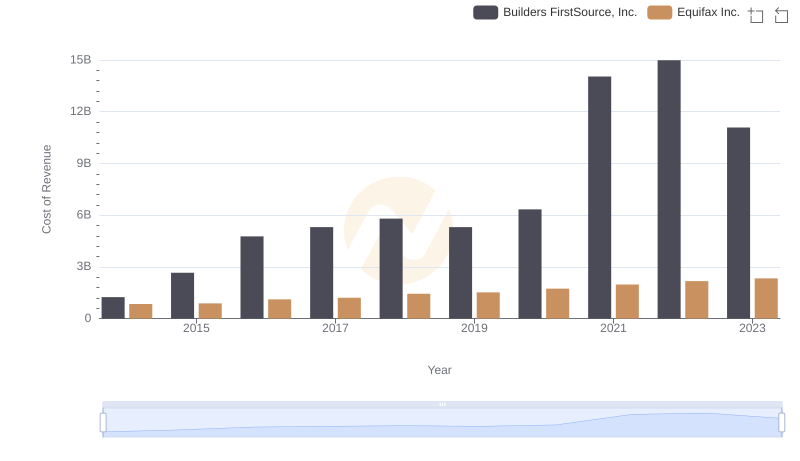
Cost Insights: Breaking Down Equifax Inc. and Builders FirstSource, Inc.'s Expenses
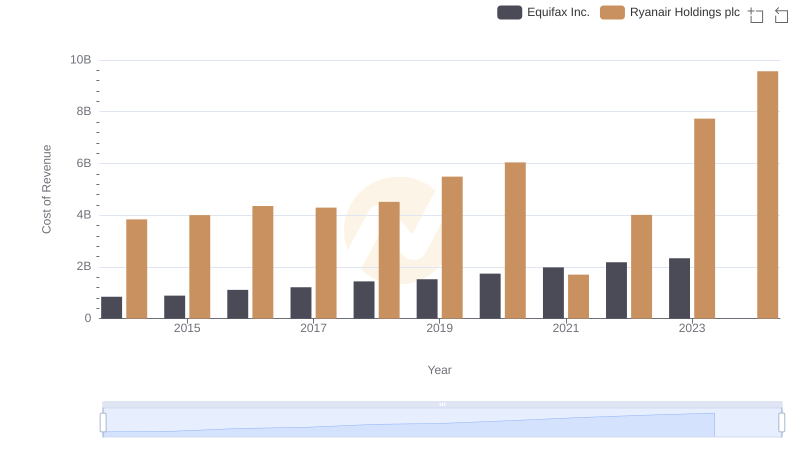
Equifax Inc. vs Ryanair Holdings plc: Efficiency in Cost of Revenue Explored
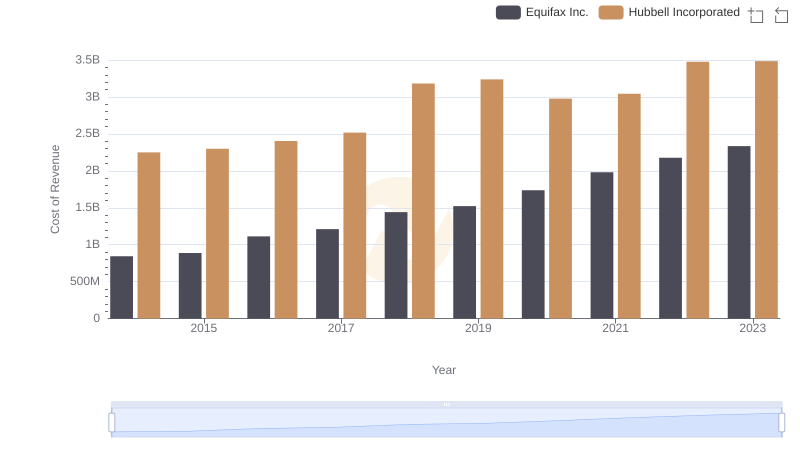
Cost Insights: Breaking Down Equifax Inc. and Hubbell Incorporated's Expenses
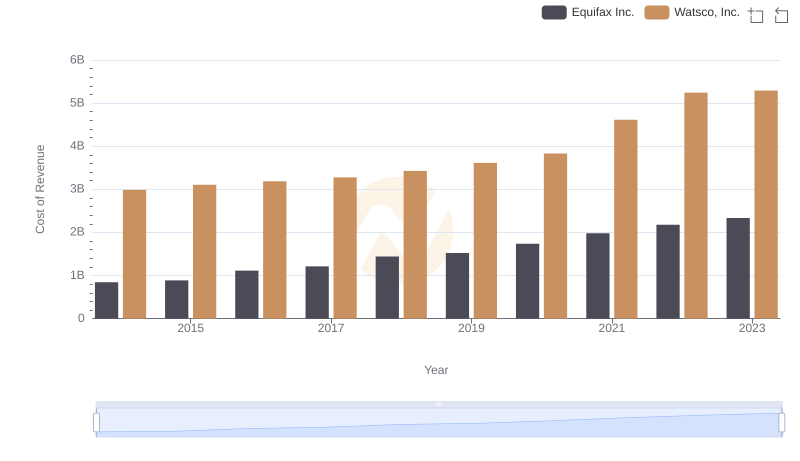
Cost of Revenue: Key Insights for Equifax Inc. and Watsco, Inc.
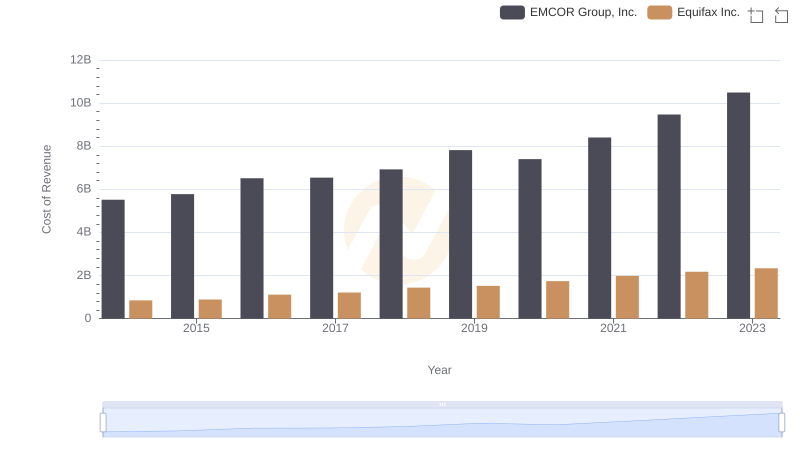
Equifax Inc. vs EMCOR Group, Inc.: Efficiency in Cost of Revenue Explored
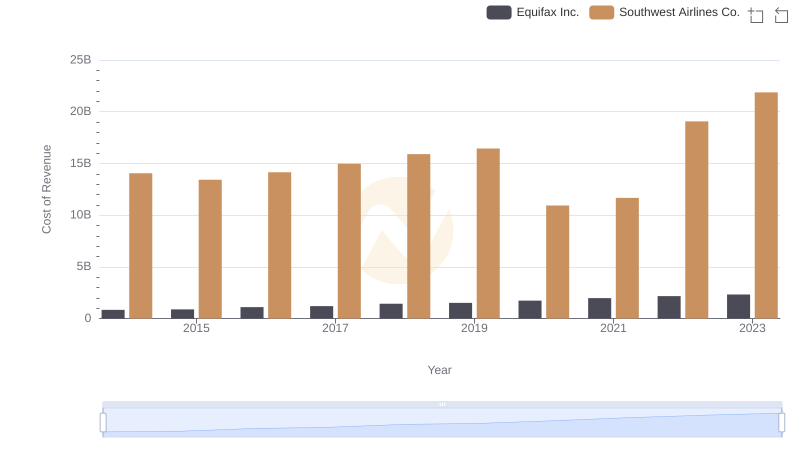
Equifax Inc. vs Southwest Airlines Co.: Efficiency in Cost of Revenue Explored
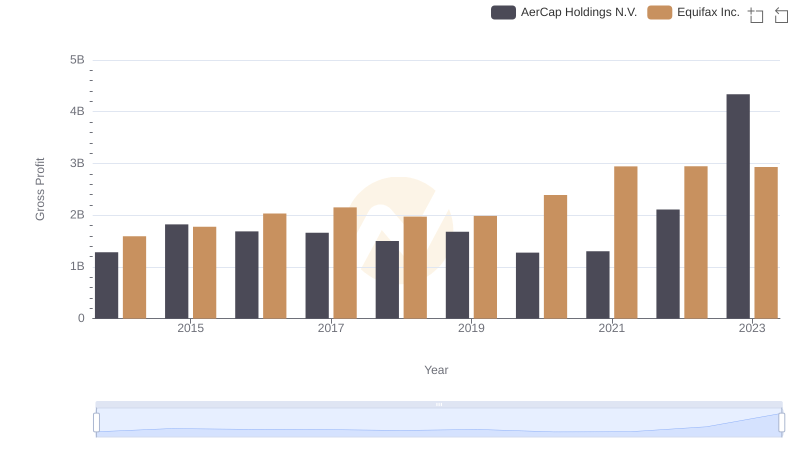
Key Insights on Gross Profit: Equifax Inc. vs AerCap Holdings N.V.
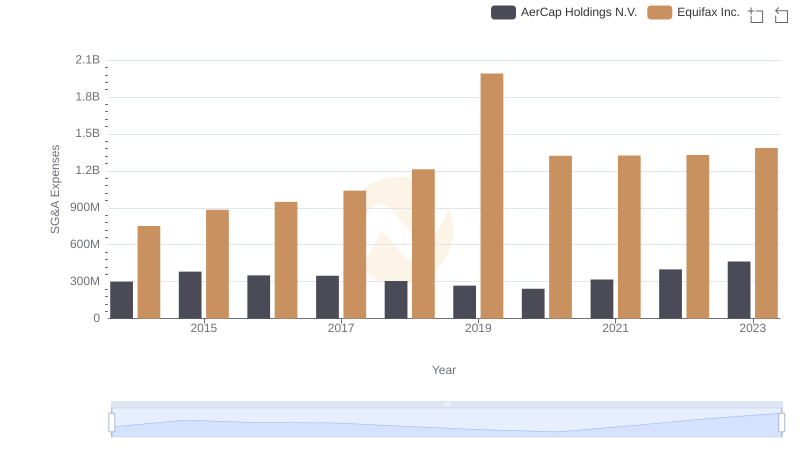
Comparing SG&A Expenses: Equifax Inc. vs AerCap Holdings N.V. Trends and Insights
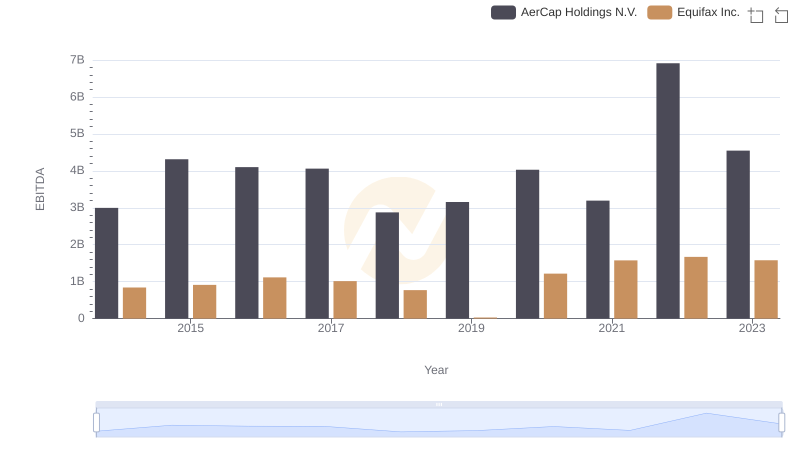
A Side-by-Side Analysis of EBITDA: Equifax Inc. and AerCap Holdings N.V.