| __timestamp | Cisco Systems, Inc. | Fiserv, Inc. |
|---|---|---|
| Wednesday, January 1, 2014 | 11437000000 | 975000000 |
| Thursday, January 1, 2015 | 11861000000 | 1034000000 |
| Friday, January 1, 2016 | 11433000000 | 1101000000 |
| Sunday, January 1, 2017 | 11177000000 | 1150000000 |
| Monday, January 1, 2018 | 11386000000 | 1228000000 |
| Tuesday, January 1, 2019 | 11398000000 | 3284000000 |
| Wednesday, January 1, 2020 | 11094000000 | 5652000000 |
| Friday, January 1, 2021 | 11411000000 | 5810000000 |
| Saturday, January 1, 2022 | 11186000000 | 6059000000 |
| Sunday, January 1, 2023 | 12358000000 | 6576000000 |
| Monday, January 1, 2024 | 13177000000 | 6564000000 |
Unleashing insights
In the ever-evolving landscape of technology and financial services, understanding operational efficiency is crucial. Cisco Systems, Inc. and Fiserv, Inc. offer a fascinating study in contrasts when it comes to Selling, General, and Administrative (SG&A) expenses. Over the past decade, Cisco has consistently maintained SG&A expenses around 11% of its revenue, showcasing a stable operational strategy. In contrast, Fiserv's SG&A expenses have surged by over 570% from 2014 to 2023, reflecting its aggressive expansion and acquisition strategy.
From 2014 to 2023, Cisco's SG&A expenses grew modestly, peaking in 2024. Meanwhile, Fiserv's expenses saw a dramatic rise, particularly post-2018, aligning with its strategic acquisitions. This divergence highlights the different paths these companies have taken to navigate their respective industries. As we look to the future, the question remains: will Fiserv's investments pay off, or will Cisco's steady approach prove more sustainable?
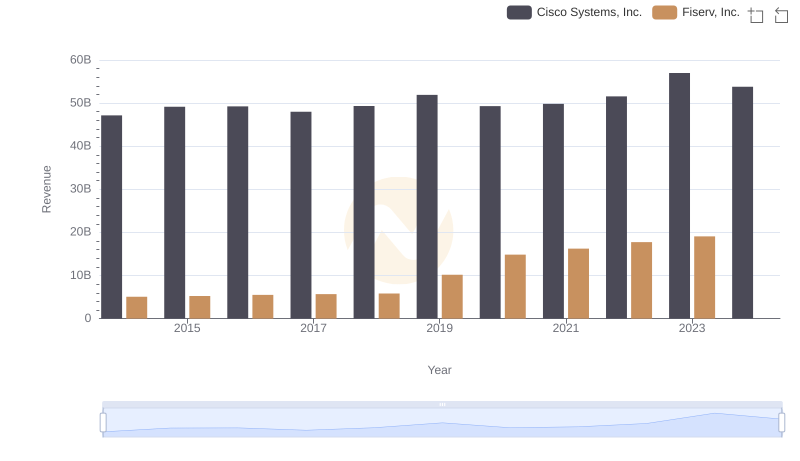
Comparing Revenue Performance: Cisco Systems, Inc. or Fiserv, Inc.?

Revenue Insights: Cisco Systems, Inc. and Fiserv, Inc. Performance Compared

Analyzing Cost of Revenue: Cisco Systems, Inc. and Fiserv, Inc.
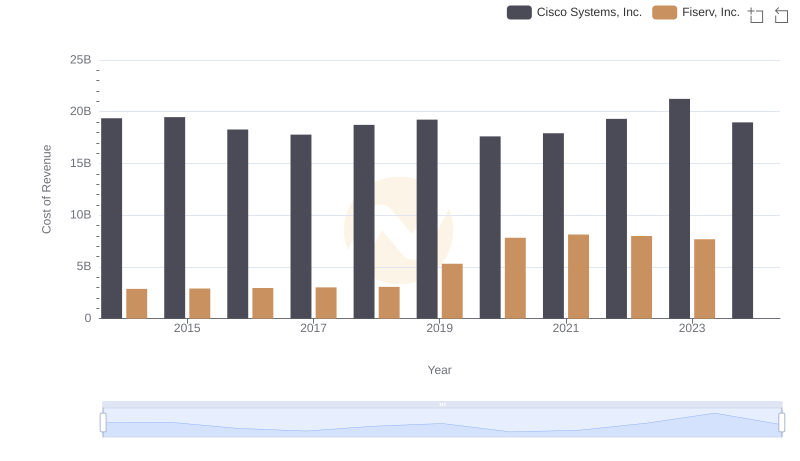
Cost of Revenue Comparison: Cisco Systems, Inc. vs Fiserv, Inc.

Key Insights on Gross Profit: Cisco Systems, Inc. vs Fiserv, Inc.
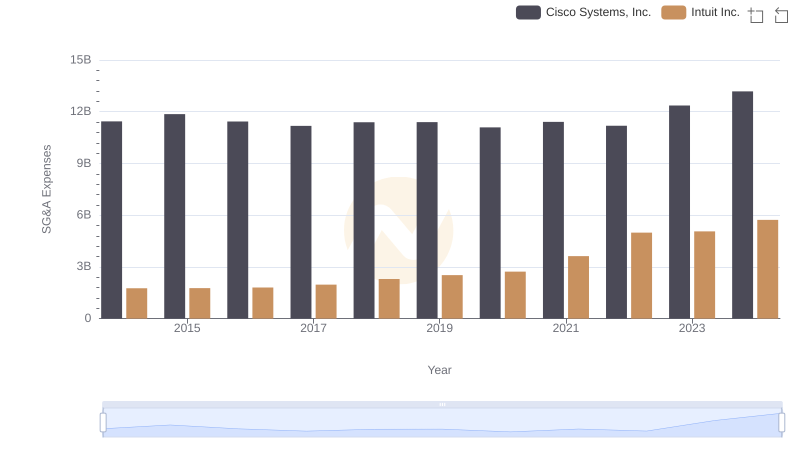
Cost Management Insights: SG&A Expenses for Cisco Systems, Inc. and Intuit Inc.
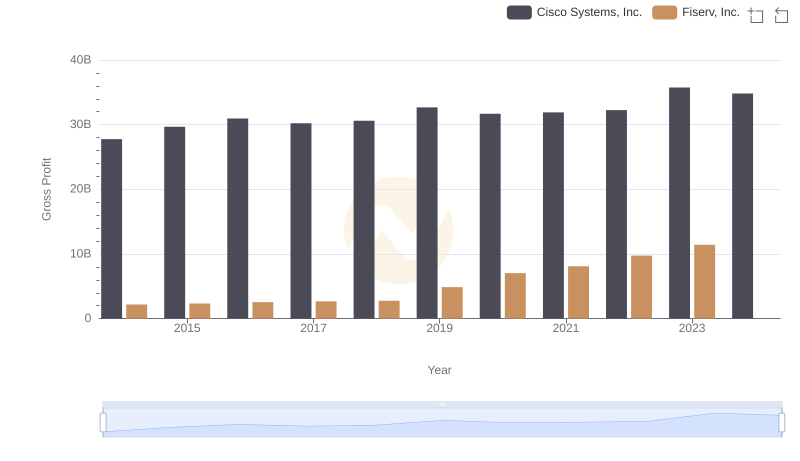
Key Insights on Gross Profit: Cisco Systems, Inc. vs Fiserv, Inc.
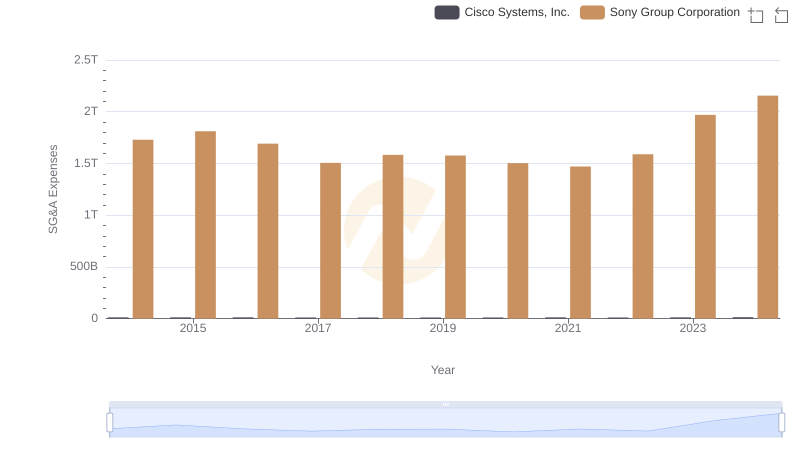
Comparing SG&A Expenses: Cisco Systems, Inc. vs Sony Group Corporation Trends and Insights
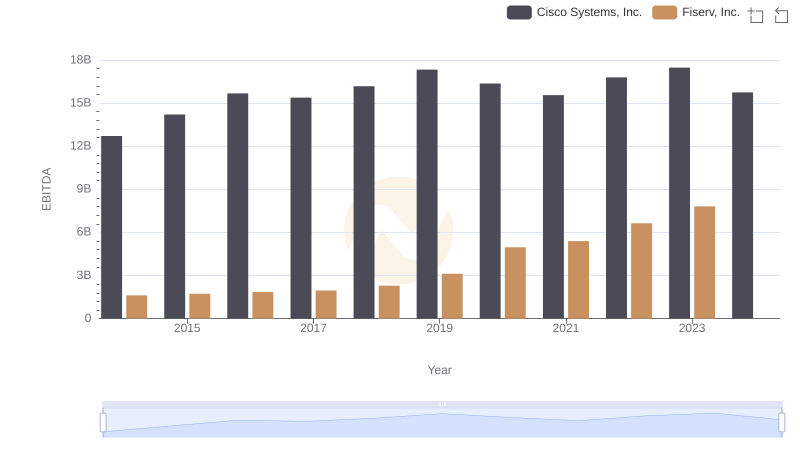
EBITDA Analysis: Evaluating Cisco Systems, Inc. Against Fiserv, Inc.
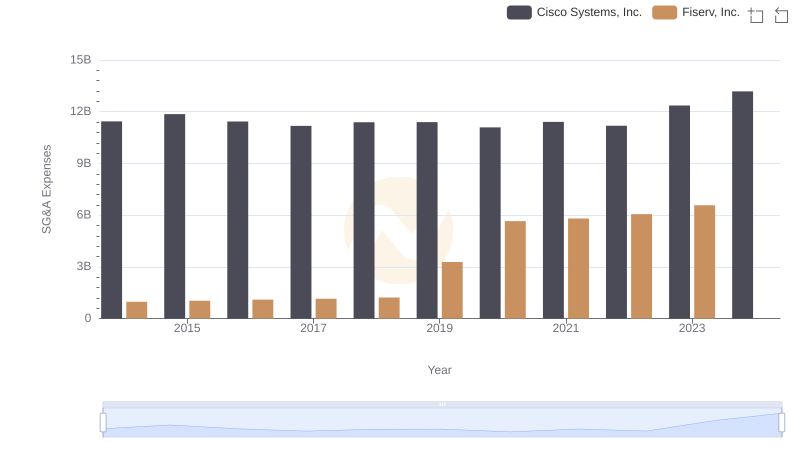
Comparing SG&A Expenses: Cisco Systems, Inc. vs Fiserv, Inc. Trends and Insights
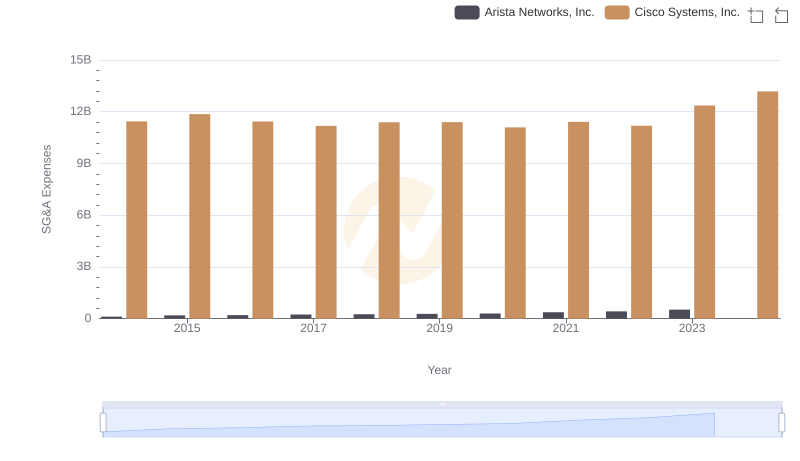
Operational Costs Compared: SG&A Analysis of Cisco Systems, Inc. and Arista Networks, Inc.

A Professional Review of EBITDA: Cisco Systems, Inc. Compared to Fiserv, Inc.