| __timestamp | Cisco Systems, Inc. | Shopify Inc. |
|---|---|---|
| Wednesday, January 1, 2014 | 11437000000 | 57495000 |
| Thursday, January 1, 2015 | 11861000000 | 89105000 |
| Friday, January 1, 2016 | 11433000000 | 172324000 |
| Sunday, January 1, 2017 | 11177000000 | 293413000 |
| Monday, January 1, 2018 | 11386000000 | 457513000 |
| Tuesday, January 1, 2019 | 11398000000 | 651775000 |
| Wednesday, January 1, 2020 | 11094000000 | 847391000 |
| Friday, January 1, 2021 | 11411000000 | 1276401000 |
| Saturday, January 1, 2022 | 11186000000 | 1938255000 |
| Sunday, January 1, 2023 | 12358000000 | 1711000000 |
| Monday, January 1, 2024 | 13177000000 | 1796000000 |
Data in motion
In the ever-evolving tech landscape, understanding the financial strategies of industry giants like Cisco Systems, Inc. and Shopify Inc. offers valuable insights. Over the past decade, Cisco's SG&A expenses have shown a steady pattern, averaging around $11.6 billion annually. In contrast, Shopify's SG&A spending has surged, growing from a modest $57 million in 2014 to a peak of nearly $1.94 billion in 2022, reflecting its rapid expansion and market penetration.
Cisco's spending remained relatively stable, with a notable increase of approximately 15% from 2022 to 2023, reaching $12.36 billion. Meanwhile, Shopify's expenses saw a dramatic rise, particularly between 2020 and 2022, highlighting its aggressive growth strategy. However, data for 2024 is missing, leaving room for speculation on future trends. This comparison underscores the diverse approaches these companies take in managing operational costs, with Cisco focusing on stability and Shopify on growth.
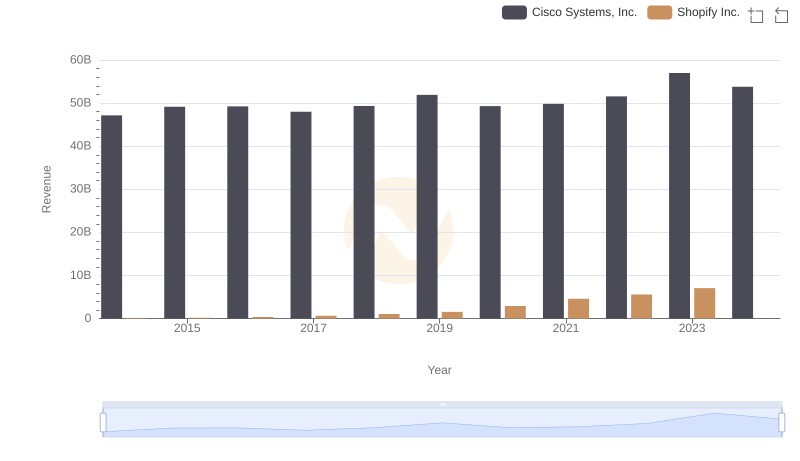
Cisco Systems, Inc. vs Shopify Inc.: Examining Key Revenue Metrics
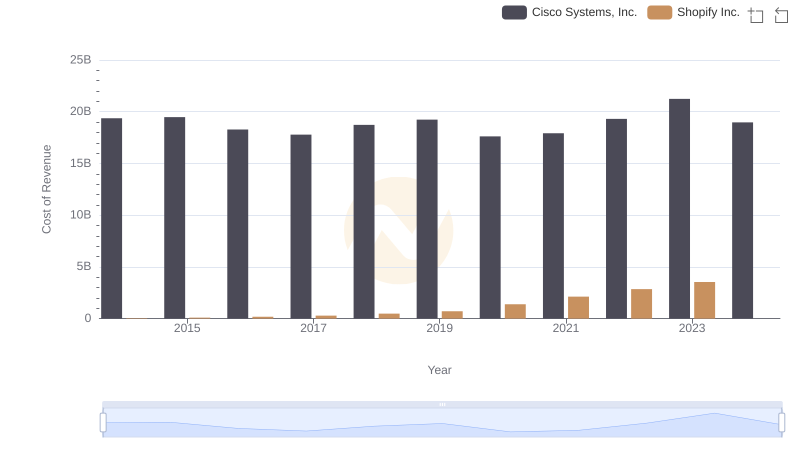
Cost of Revenue Comparison: Cisco Systems, Inc. vs Shopify Inc.
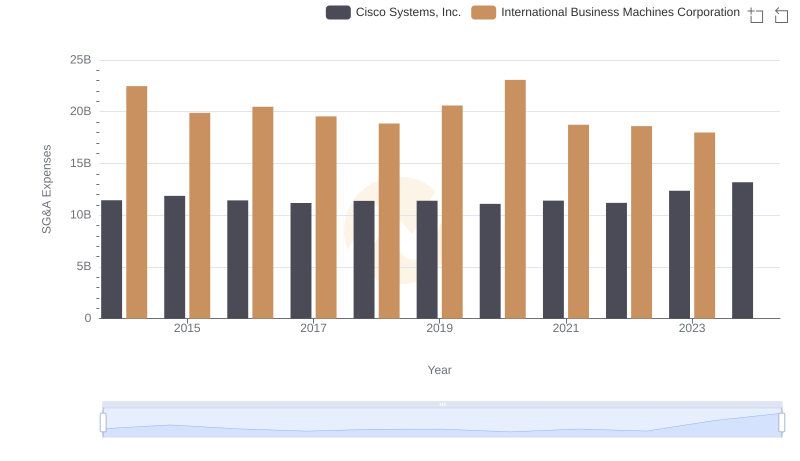
Breaking Down SG&A Expenses: Cisco Systems, Inc. vs International Business Machines Corporation
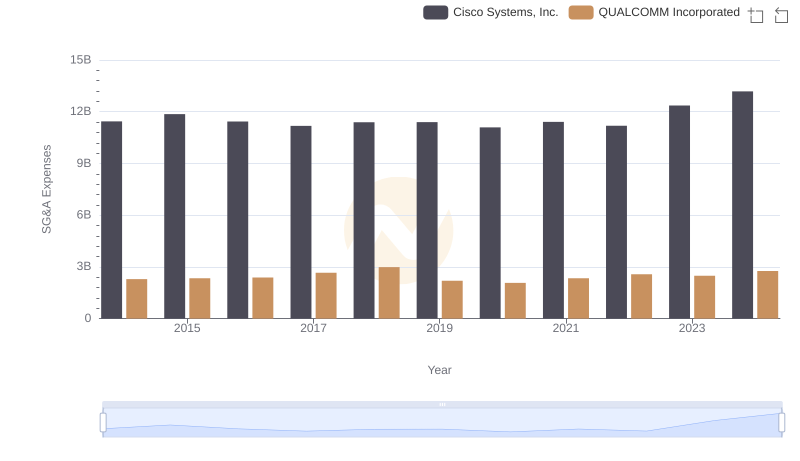
SG&A Efficiency Analysis: Comparing Cisco Systems, Inc. and QUALCOMM Incorporated
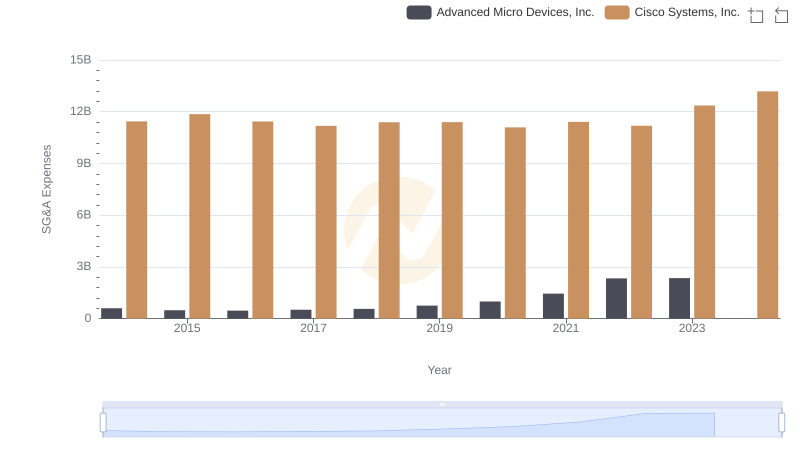
SG&A Efficiency Analysis: Comparing Cisco Systems, Inc. and Advanced Micro Devices, Inc.
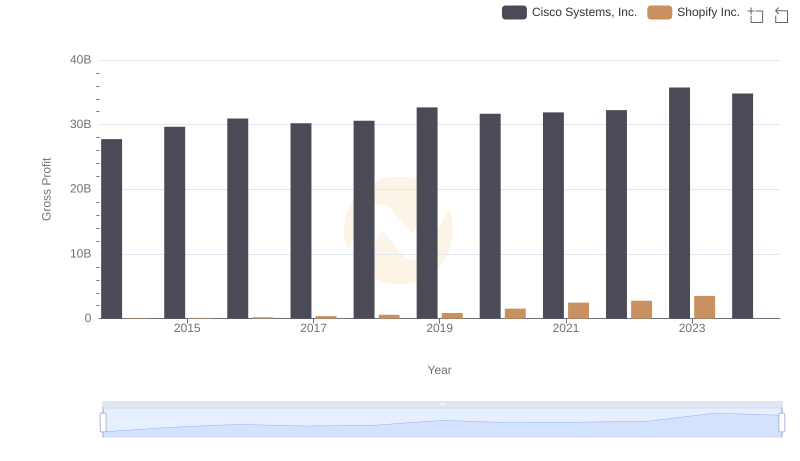
Gross Profit Analysis: Comparing Cisco Systems, Inc. and Shopify Inc.
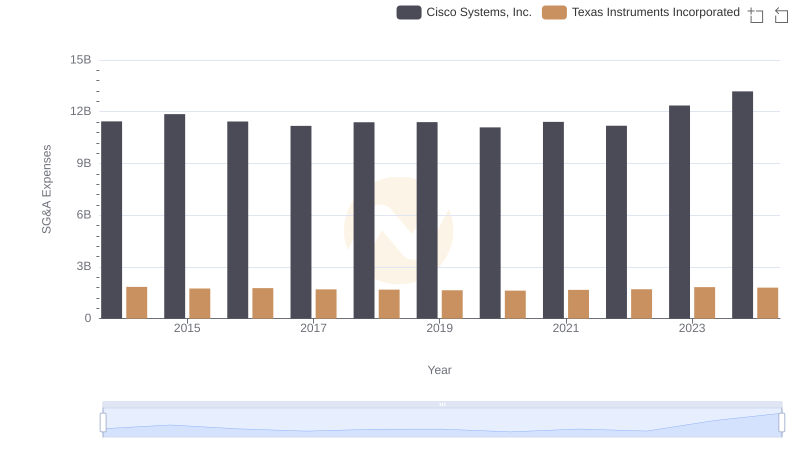
Cisco Systems, Inc. or Texas Instruments Incorporated: Who Manages SG&A Costs Better?
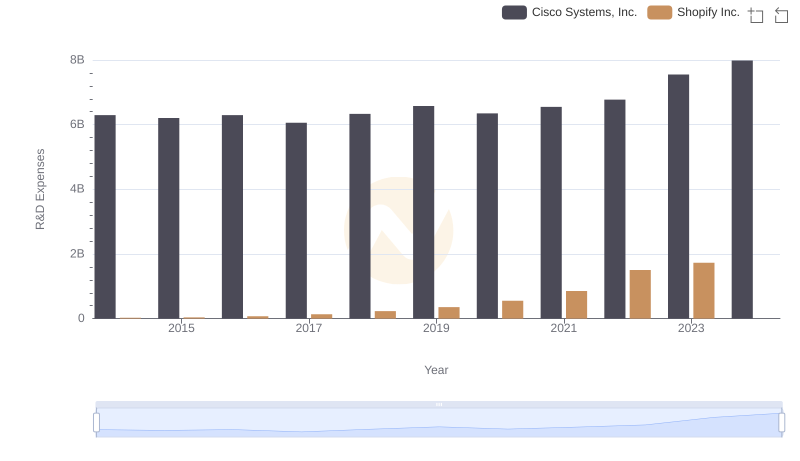
R&D Spending Showdown: Cisco Systems, Inc. vs Shopify Inc.
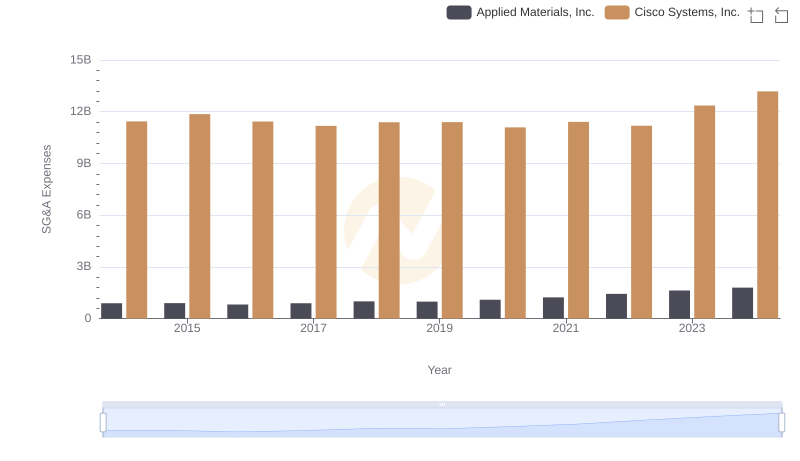
Operational Costs Compared: SG&A Analysis of Cisco Systems, Inc. and Applied Materials, Inc.
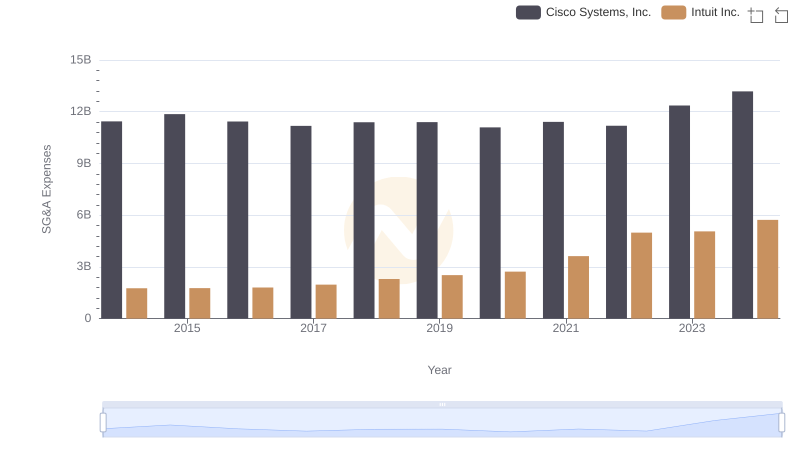
Cost Management Insights: SG&A Expenses for Cisco Systems, Inc. and Intuit Inc.
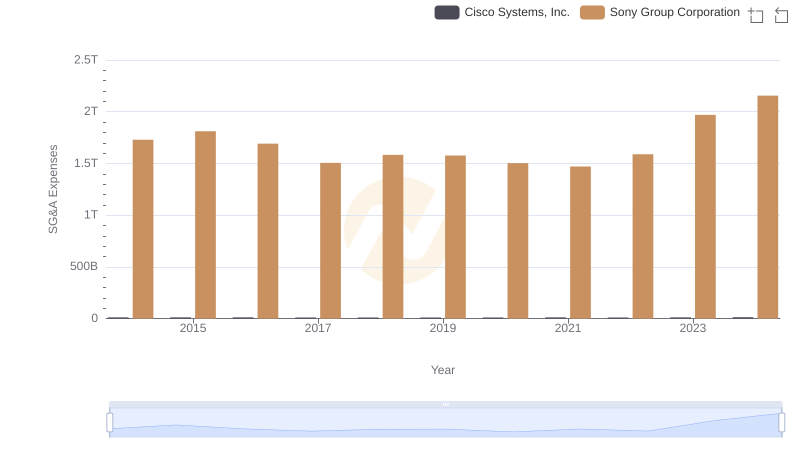
Comparing SG&A Expenses: Cisco Systems, Inc. vs Sony Group Corporation Trends and Insights
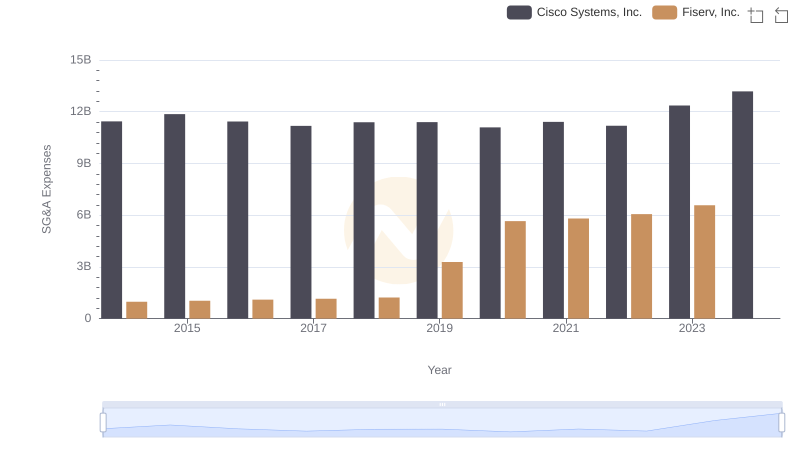
SG&A Efficiency Analysis: Comparing Cisco Systems, Inc. and Fiserv, Inc.