| __timestamp | AerCap Holdings N.V. | Axon Enterprise, Inc. |
|---|---|---|
| Wednesday, January 1, 2014 | 299900000 | 54158000 |
| Thursday, January 1, 2015 | 381308000 | 69698000 |
| Friday, January 1, 2016 | 351012000 | 108076000 |
| Sunday, January 1, 2017 | 348291000 | 138692000 |
| Monday, January 1, 2018 | 305226000 | 156886000 |
| Tuesday, January 1, 2019 | 267458000 | 212959000 |
| Wednesday, January 1, 2020 | 242161000 | 307286000 |
| Friday, January 1, 2021 | 317888000 | 515007000 |
| Saturday, January 1, 2022 | 399530000 | 401575000 |
| Sunday, January 1, 2023 | 464128000 | 496874000 |
Unleashing insights
In the ever-evolving landscape of corporate finance, understanding the trends in Selling, General, and Administrative (SG&A) expenses is crucial. From 2014 to 2023, Axon Enterprise, Inc. and AerCap Holdings N.V. have shown distinct trajectories in their SG&A expenditures.
Axon Enterprise, Inc. has seen a remarkable increase, with expenses growing nearly tenfold from 2014 to 2023. This surge reflects Axon's aggressive expansion and investment in innovation. In contrast, AerCap Holdings N.V. maintained a more stable SG&A profile, with a modest 55% increase over the same period, indicating a focus on operational efficiency.
By 2023, both companies reported similar SG&A expenses, highlighting Axon's rapid growth and AerCap's steady management. This comparison offers valuable insights into how different business strategies impact financial outcomes over time.
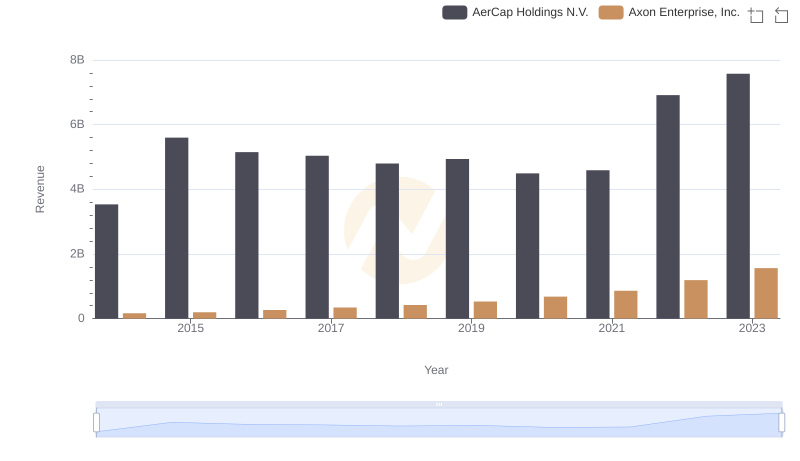
Comparing Revenue Performance: Axon Enterprise, Inc. or AerCap Holdings N.V.?
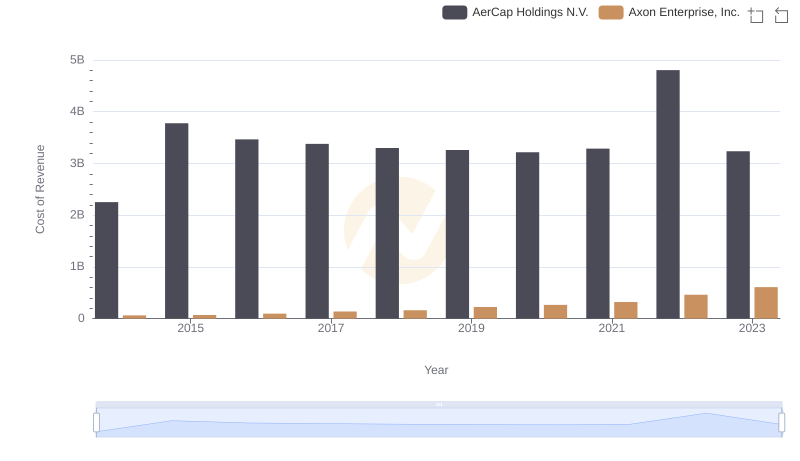
Cost of Revenue: Key Insights for Axon Enterprise, Inc. and AerCap Holdings N.V.
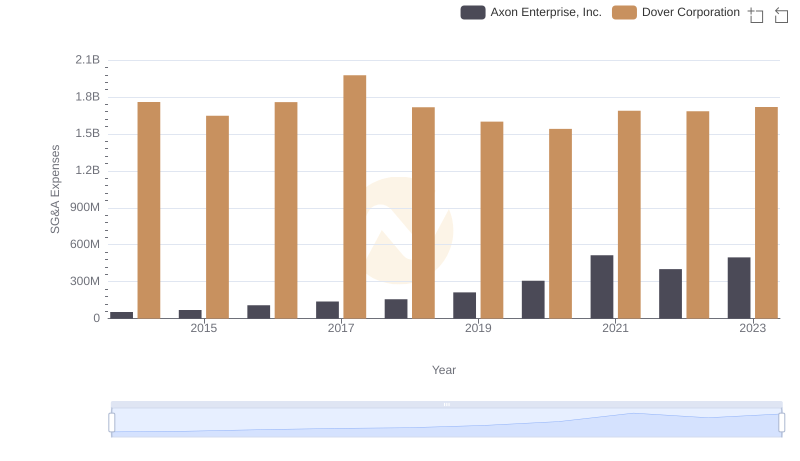
Selling, General, and Administrative Costs: Axon Enterprise, Inc. vs Dover Corporation
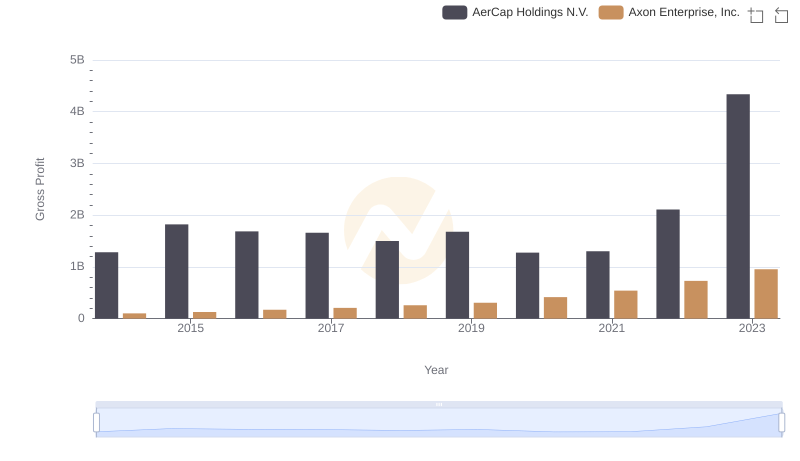
Key Insights on Gross Profit: Axon Enterprise, Inc. vs AerCap Holdings N.V.
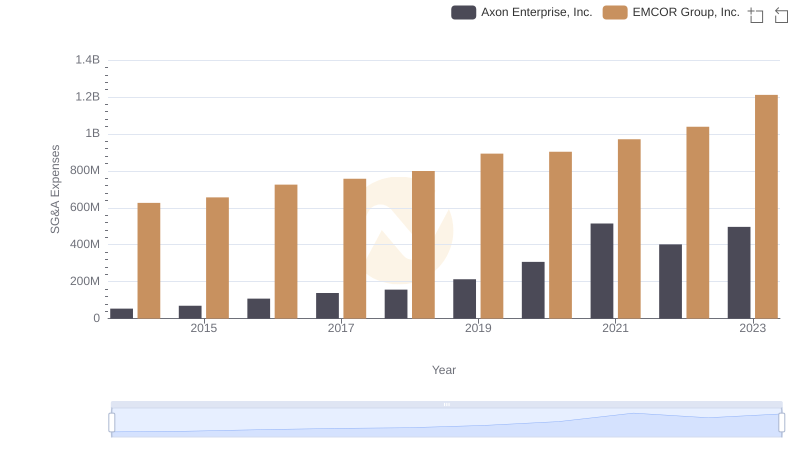
SG&A Efficiency Analysis: Comparing Axon Enterprise, Inc. and EMCOR Group, Inc.
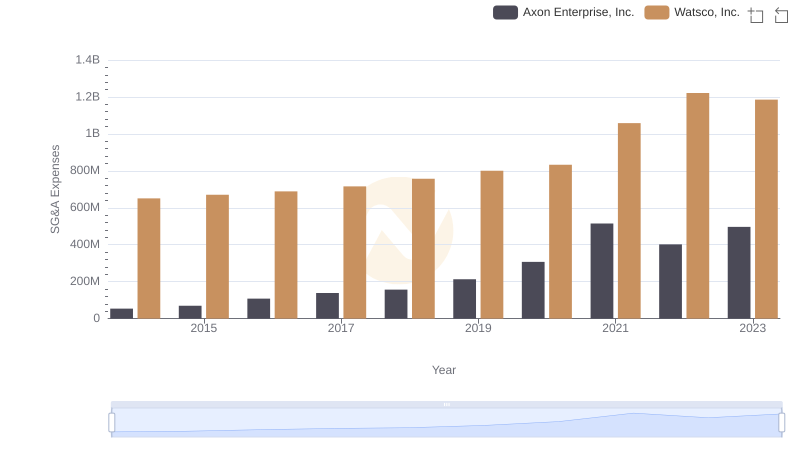
Comparing SG&A Expenses: Axon Enterprise, Inc. vs Watsco, Inc. Trends and Insights

Axon Enterprise, Inc. vs Builders FirstSource, Inc.: SG&A Expense Trends
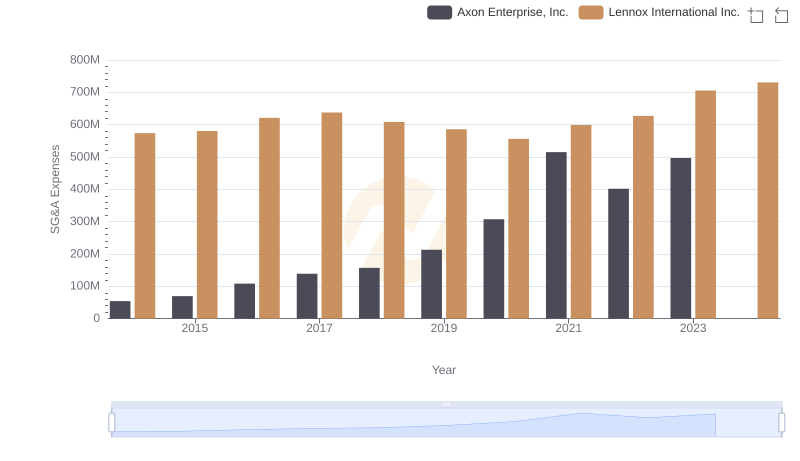
Axon Enterprise, Inc. and Lennox International Inc.: SG&A Spending Patterns Compared
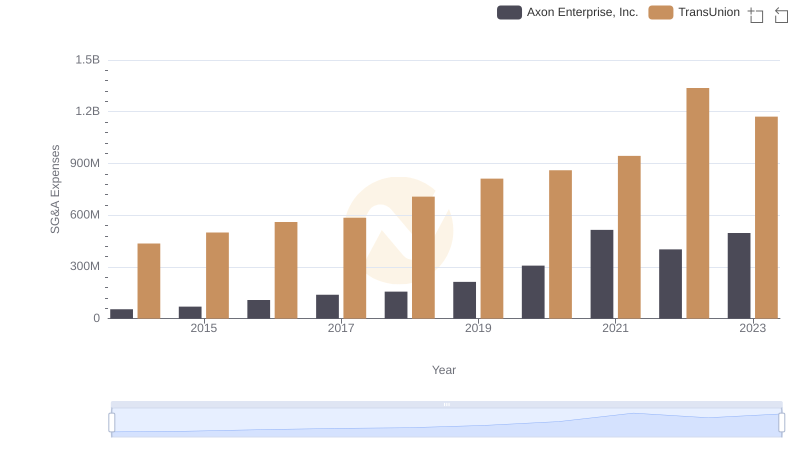
Selling, General, and Administrative Costs: Axon Enterprise, Inc. vs TransUnion
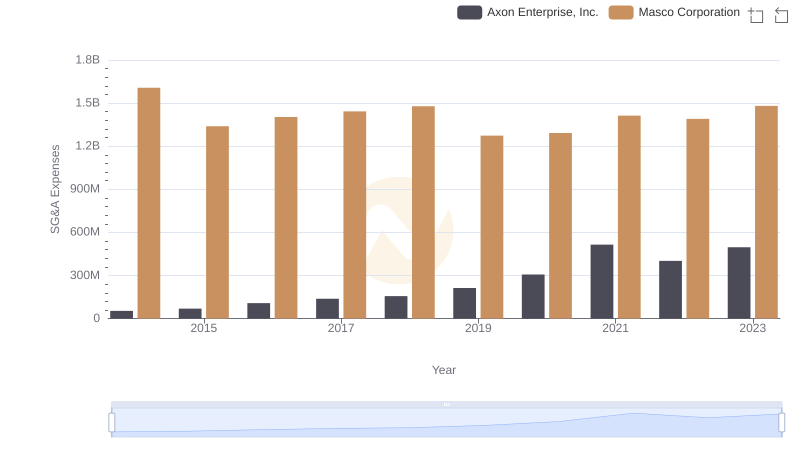
Operational Costs Compared: SG&A Analysis of Axon Enterprise, Inc. and Masco Corporation