| __timestamp | AerCap Holdings N.V. | Axon Enterprise, Inc. |
|---|---|---|
| Wednesday, January 1, 2014 | 3535797000 | 164525000 |
| Thursday, January 1, 2015 | 5598662000 | 197892000 |
| Friday, January 1, 2016 | 5152131000 | 268245000 |
| Sunday, January 1, 2017 | 5037493000 | 343798000 |
| Monday, January 1, 2018 | 4799980000 | 420068000 |
| Tuesday, January 1, 2019 | 4937340000 | 530860000 |
| Wednesday, January 1, 2020 | 4493629000 | 681003000 |
| Friday, January 1, 2021 | 4588930000 | 863381000 |
| Saturday, January 1, 2022 | 6914985000 | 1189935000 |
| Sunday, January 1, 2023 | 7574664000 | 1563391000 |
Unleashing insights
In the dynamic world of business, revenue growth is a key indicator of a company's success. This chart provides a fascinating comparison between Axon Enterprise, Inc. and AerCap Holdings N.V. over the past decade. AerCap Holdings, a leader in aircraft leasing, has consistently outperformed Axon in terms of revenue. In 2023, AerCap's revenue surged to approximately $7.6 billion, marking a 114% increase from 2014. Meanwhile, Axon Enterprise, known for its innovative public safety technologies, has shown impressive growth, with its revenue climbing by nearly 850% from 2014 to 2023, reaching around $1.6 billion.
Despite the difference in scale, Axon's rapid growth trajectory is noteworthy, reflecting its expanding market presence and product adoption. This comparison highlights the diverse paths to success in different industries, with AerCap's steady growth contrasting with Axon's explosive rise.
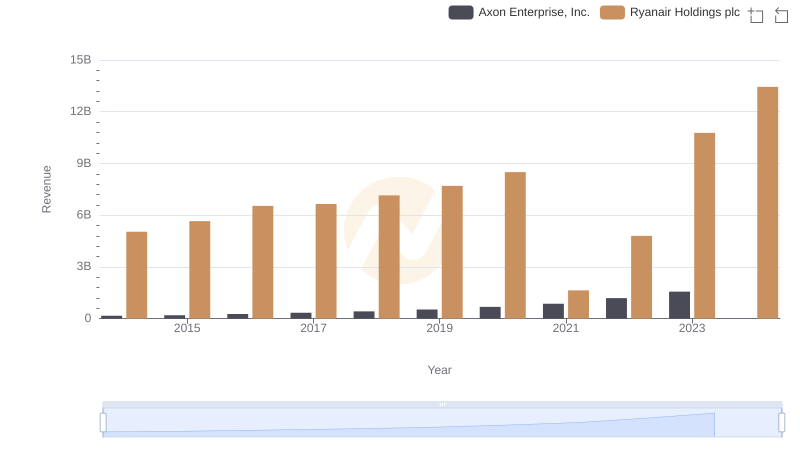
Axon Enterprise, Inc. and Ryanair Holdings plc: A Comprehensive Revenue Analysis

Revenue Insights: Axon Enterprise, Inc. and Lennox International Inc. Performance Compared
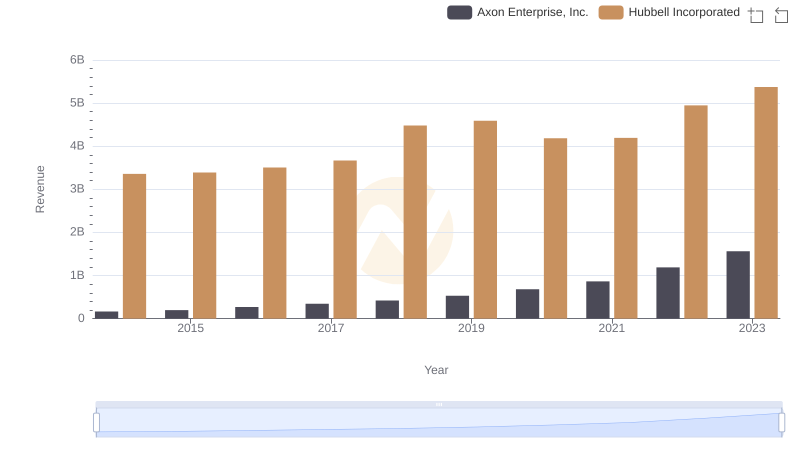
Comparing Revenue Performance: Axon Enterprise, Inc. or Hubbell Incorporated?
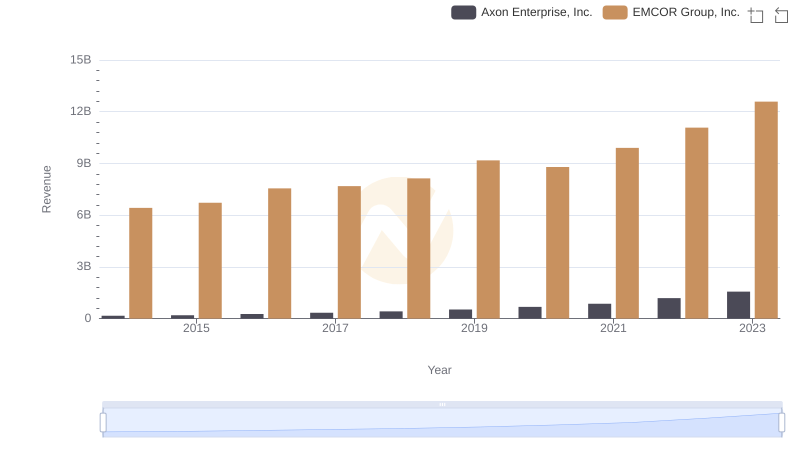
Comparing Revenue Performance: Axon Enterprise, Inc. or EMCOR Group, Inc.?
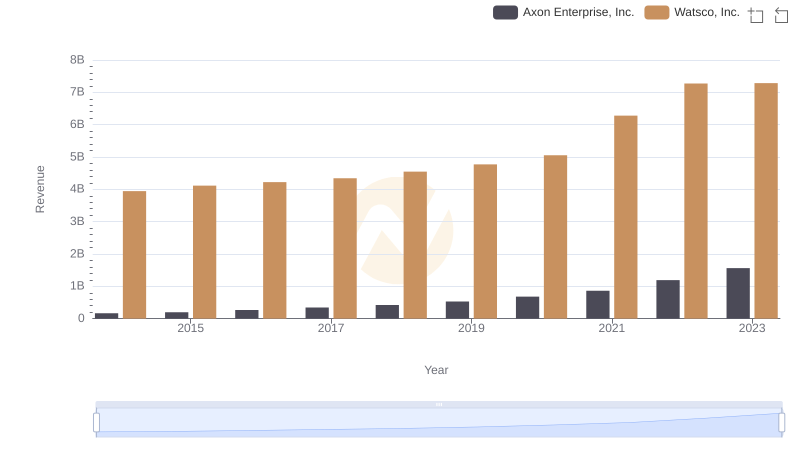
Axon Enterprise, Inc. vs Watsco, Inc.: Examining Key Revenue Metrics
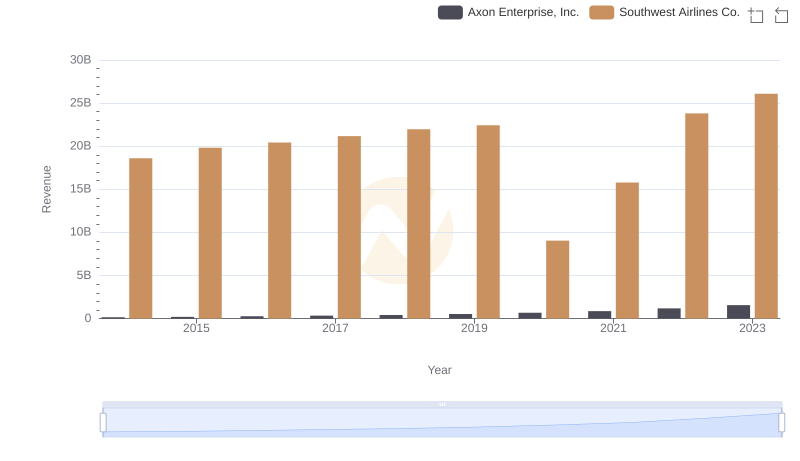
Revenue Showdown: Axon Enterprise, Inc. vs Southwest Airlines Co.
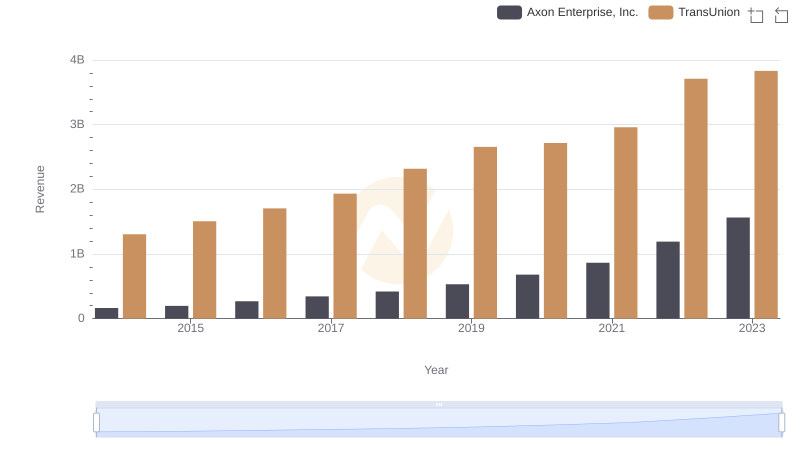
Breaking Down Revenue Trends: Axon Enterprise, Inc. vs TransUnion
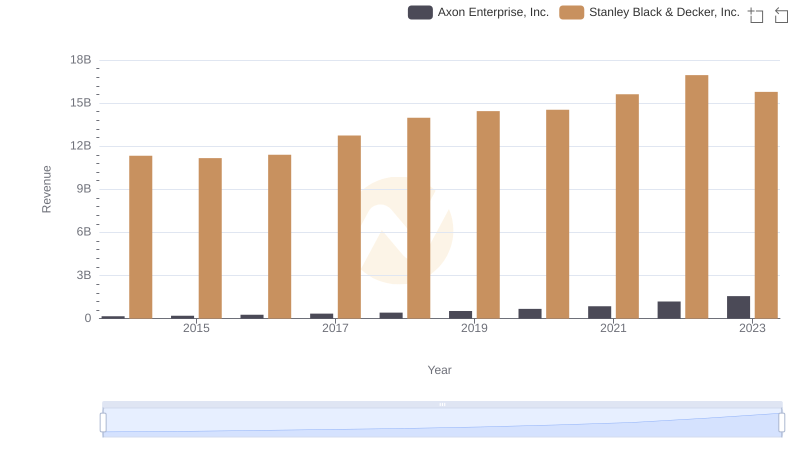
Revenue Showdown: Axon Enterprise, Inc. vs Stanley Black & Decker, Inc.
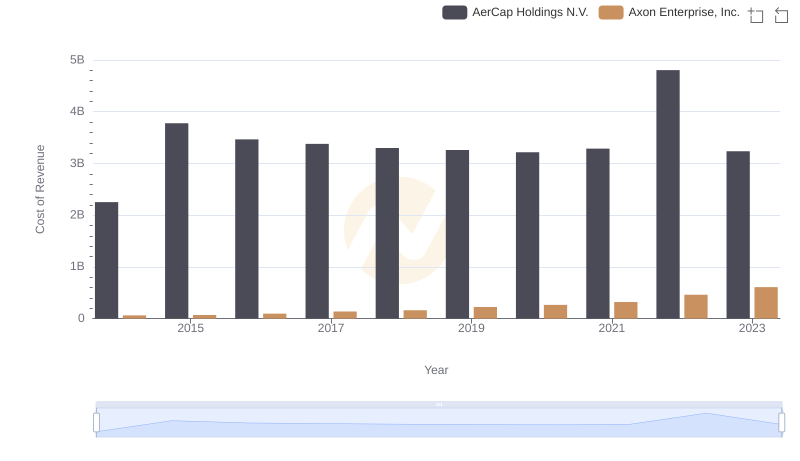
Cost of Revenue: Key Insights for Axon Enterprise, Inc. and AerCap Holdings N.V.
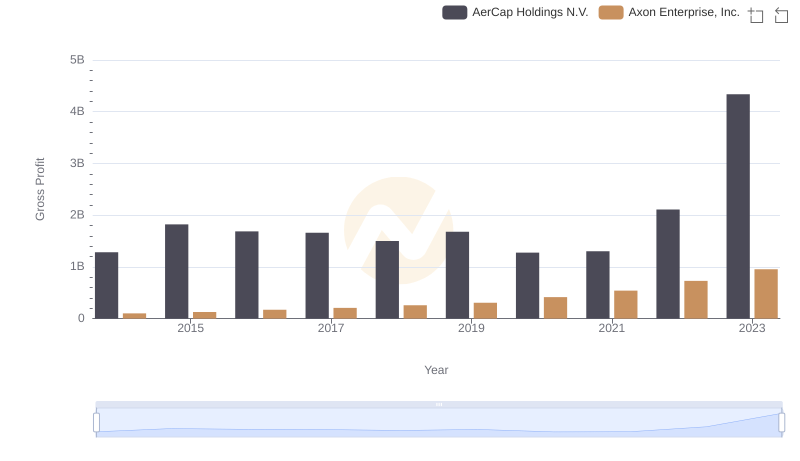
Key Insights on Gross Profit: Axon Enterprise, Inc. vs AerCap Holdings N.V.
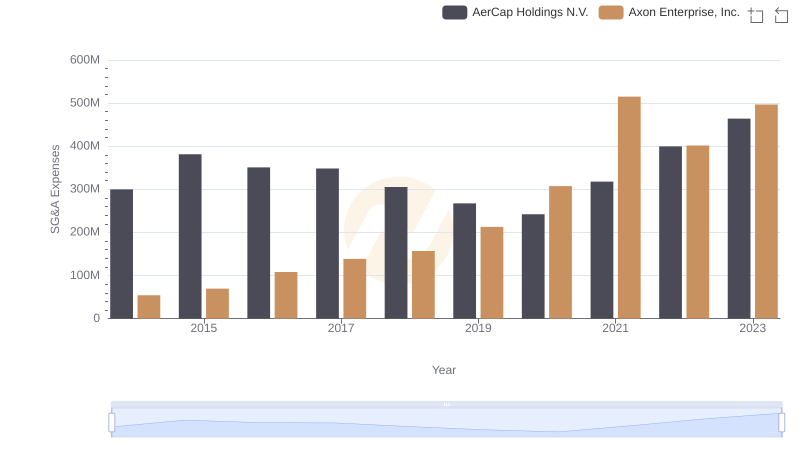
Comparing SG&A Expenses: Axon Enterprise, Inc. vs AerCap Holdings N.V. Trends and Insights