| __timestamp | AMETEK, Inc. | Watsco, Inc. |
|---|---|---|
| Wednesday, January 1, 2014 | 462637000 | 650655000 |
| Thursday, January 1, 2015 | 448592000 | 670609000 |
| Friday, January 1, 2016 | 462970000 | 688952000 |
| Sunday, January 1, 2017 | 533645000 | 715671000 |
| Monday, January 1, 2018 | 584022000 | 757452000 |
| Tuesday, January 1, 2019 | 610280000 | 800328000 |
| Wednesday, January 1, 2020 | 515630000 | 833051000 |
| Friday, January 1, 2021 | 603944000 | 1058316000 |
| Saturday, January 1, 2022 | 644577000 | 1221382000 |
| Sunday, January 1, 2023 | 677006000 | 1185626000 |
| Monday, January 1, 2024 | 696905000 | 1262938000 |
Unveiling the hidden dimensions of data
In the competitive landscape of industrial manufacturing and distribution, understanding the financial dynamics of companies like AMETEK, Inc. and Watsco, Inc. is crucial. Over the past decade, from 2014 to 2023, these two giants have shown distinct trends in their Selling, General, and Administrative (SG&A) expenses.
AMETEK, Inc. has seen a steady increase in SG&A expenses, growing approximately 46% from 2014 to 2023. This growth reflects strategic investments in operations and market expansion. Notably, the expenses peaked in 2023, indicating a robust operational scale-up.
Watsco, Inc., on the other hand, experienced a more dramatic rise, with SG&A expenses nearly doubling over the same period. This surge, particularly between 2020 and 2022, underscores Watsco's aggressive market penetration and expansion strategies.
These trends highlight the differing strategic approaches of AMETEK and Watsco in navigating the industrial sector's challenges and opportunities.
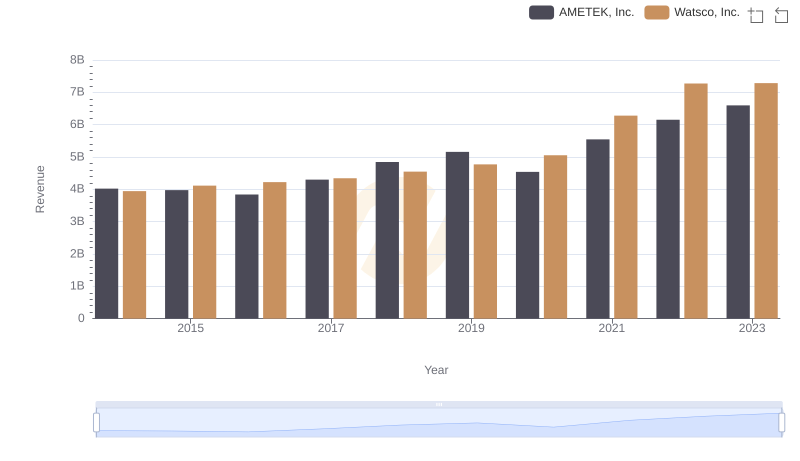
Comparing Revenue Performance: AMETEK, Inc. or Watsco, Inc.?
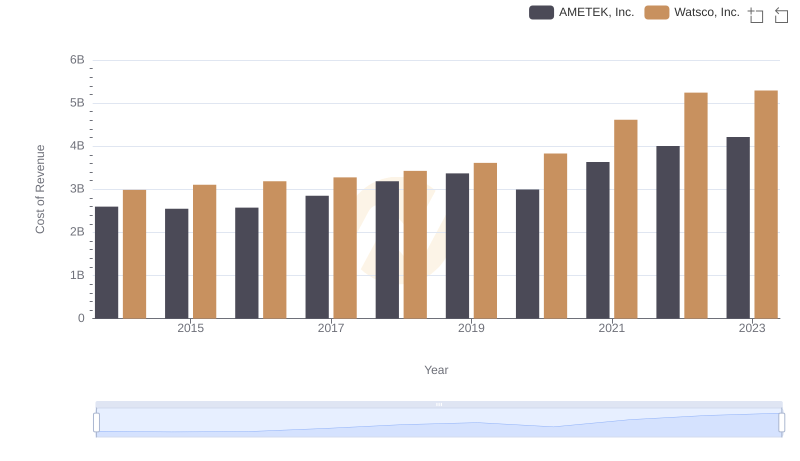
Comparing Cost of Revenue Efficiency: AMETEK, Inc. vs Watsco, Inc.
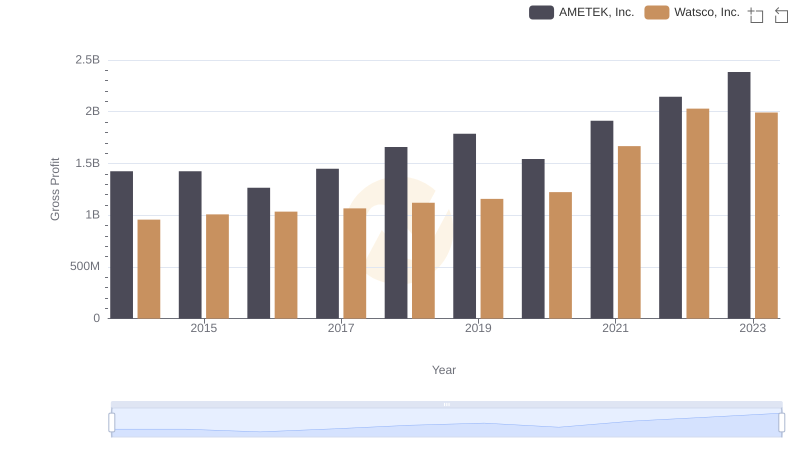
AMETEK, Inc. vs Watsco, Inc.: A Gross Profit Performance Breakdown
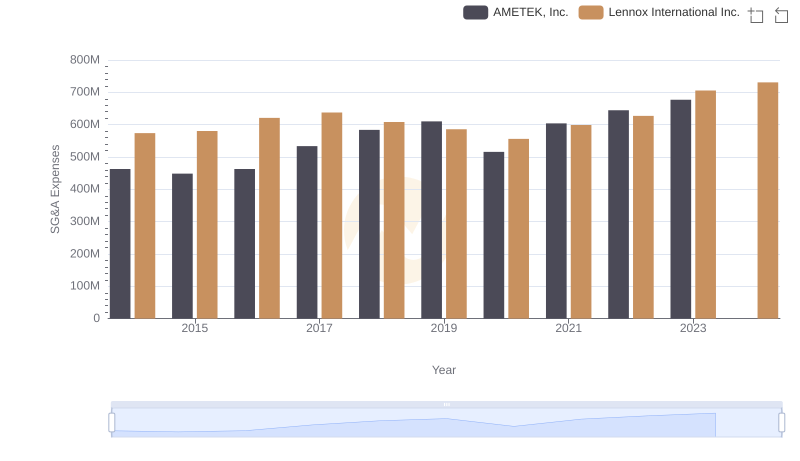
AMETEK, Inc. or Lennox International Inc.: Who Manages SG&A Costs Better?
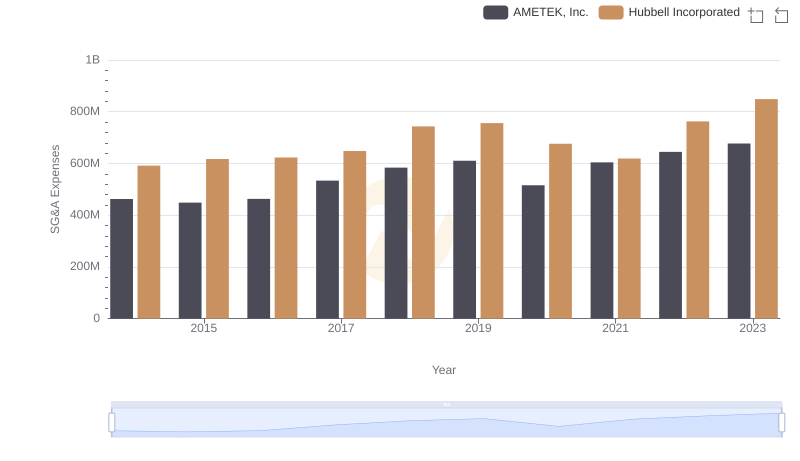
Breaking Down SG&A Expenses: AMETEK, Inc. vs Hubbell Incorporated
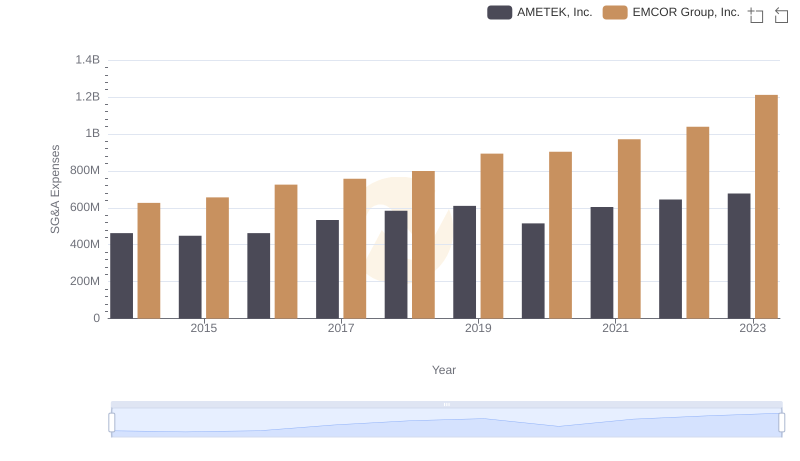
Selling, General, and Administrative Costs: AMETEK, Inc. vs EMCOR Group, Inc.
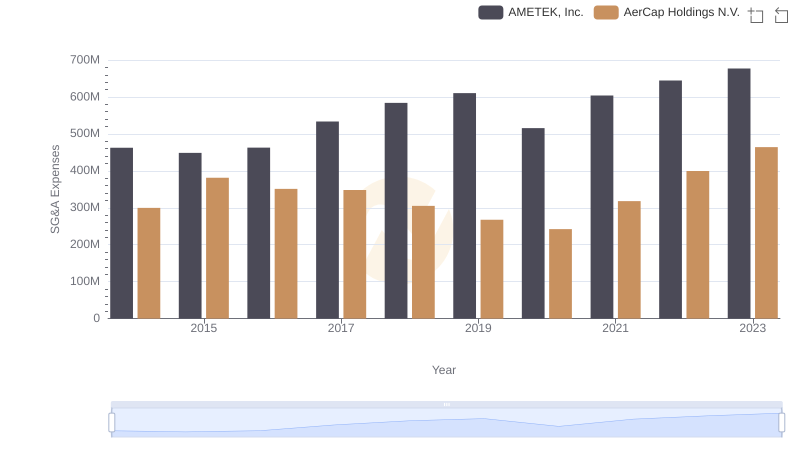
Selling, General, and Administrative Costs: AMETEK, Inc. vs AerCap Holdings N.V.
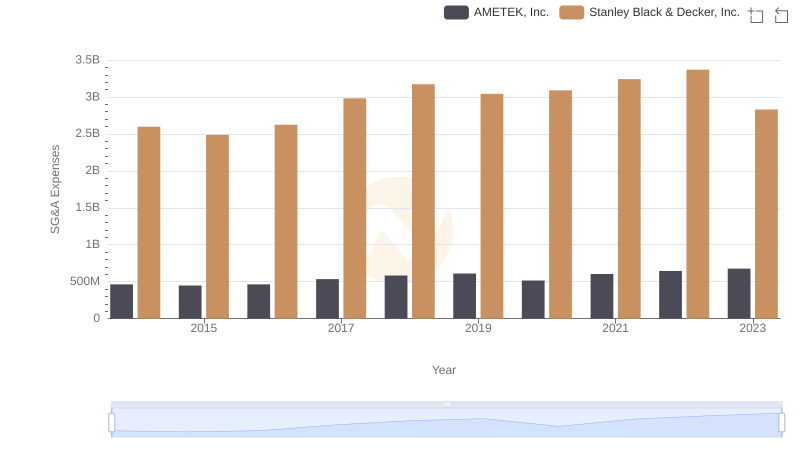
AMETEK, Inc. and Stanley Black & Decker, Inc.: SG&A Spending Patterns Compared

AMETEK, Inc. or TransUnion: Who Manages SG&A Costs Better?