| __timestamp | AMETEK, Inc. | Hubbell Incorporated |
|---|---|---|
| Wednesday, January 1, 2014 | 462637000 | 591600000 |
| Thursday, January 1, 2015 | 448592000 | 617200000 |
| Friday, January 1, 2016 | 462970000 | 622900000 |
| Sunday, January 1, 2017 | 533645000 | 648200000 |
| Monday, January 1, 2018 | 584022000 | 743500000 |
| Tuesday, January 1, 2019 | 610280000 | 756100000 |
| Wednesday, January 1, 2020 | 515630000 | 676300000 |
| Friday, January 1, 2021 | 603944000 | 619200000 |
| Saturday, January 1, 2022 | 644577000 | 762500000 |
| Sunday, January 1, 2023 | 677006000 | 848600000 |
| Monday, January 1, 2024 | 696905000 | 812500000 |
Infusing magic into the data realm
In the competitive landscape of industrial manufacturing, understanding the financial dynamics of key players is crucial. This analysis delves into the Selling, General, and Administrative (SG&A) expenses of AMETEK, Inc. and Hubbell Incorporated from 2014 to 2023. Over this period, Hubbell consistently outpaced AMETEK in SG&A spending, with a notable 43% increase from 2014 to 2023, peaking at approximately $848 million. In contrast, AMETEK's SG&A expenses grew by 46%, reaching around $677 million in 2023. This trend highlights Hubbell's aggressive investment in administrative and sales functions, potentially driving its market expansion. Meanwhile, AMETEK's steady growth reflects a more conservative approach. These insights offer a window into the strategic priorities of these industrial giants, providing valuable context for investors and industry analysts alike.
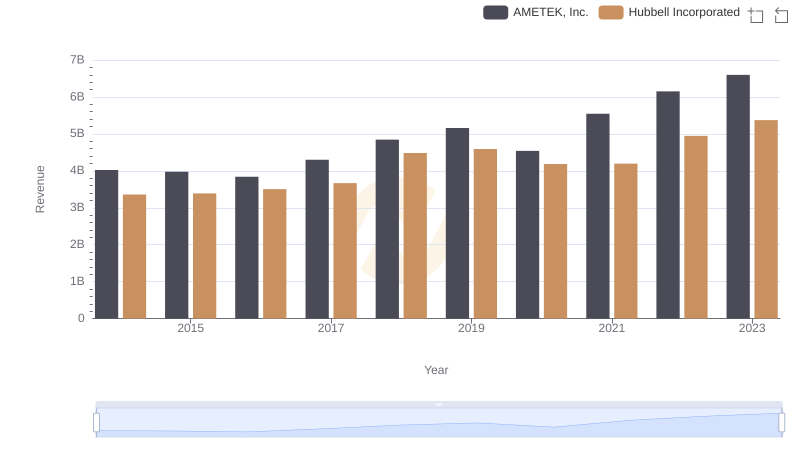
Breaking Down Revenue Trends: AMETEK, Inc. vs Hubbell Incorporated

Cost Insights: Breaking Down AMETEK, Inc. and Hubbell Incorporated's Expenses
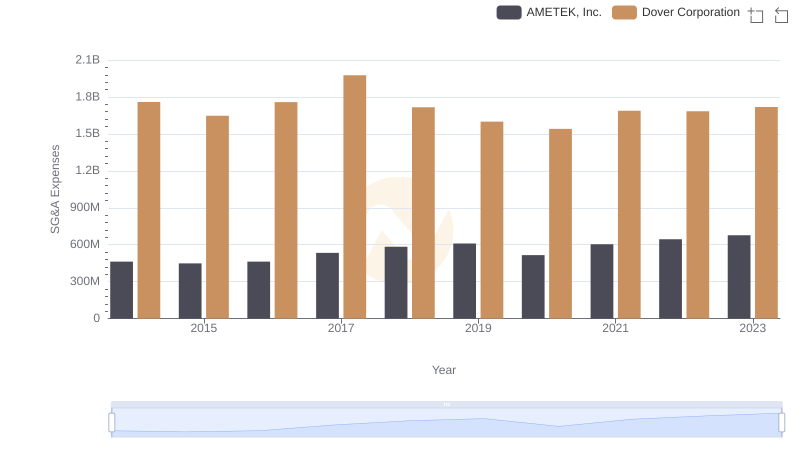
AMETEK, Inc. or Dover Corporation: Who Manages SG&A Costs Better?
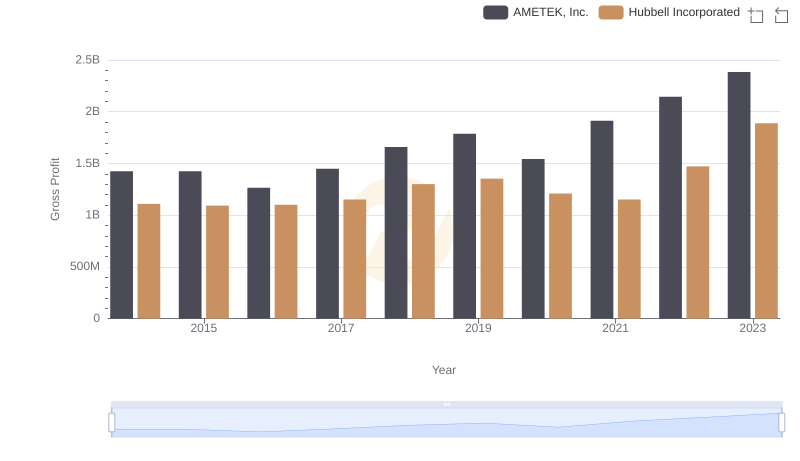
Gross Profit Analysis: Comparing AMETEK, Inc. and Hubbell Incorporated
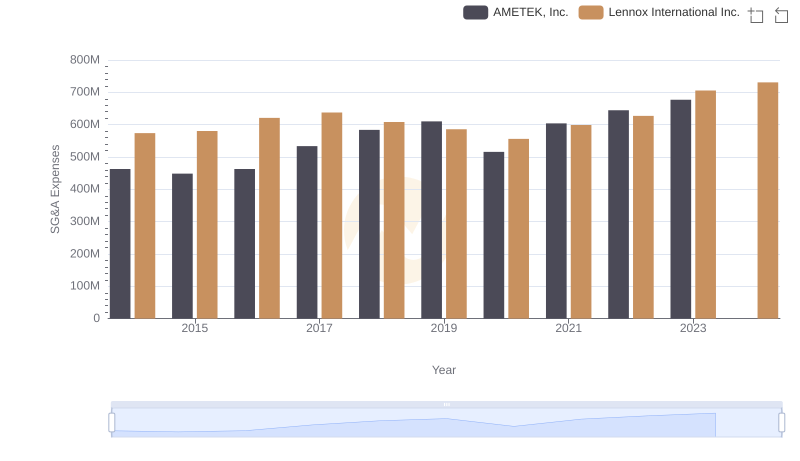
AMETEK, Inc. or Lennox International Inc.: Who Manages SG&A Costs Better?
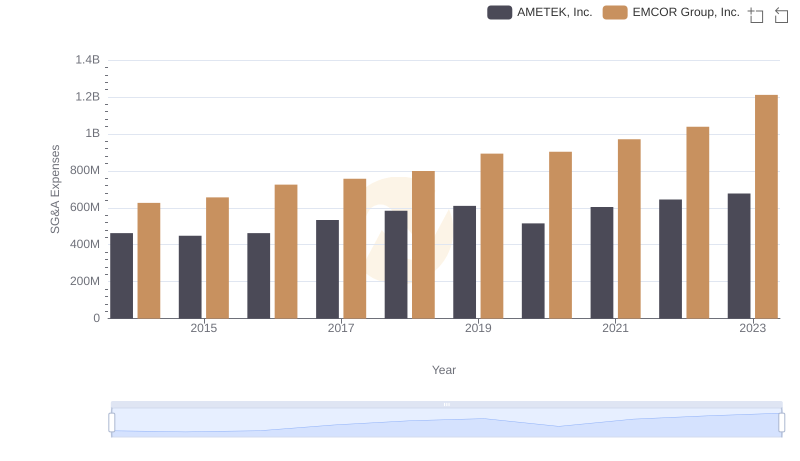
Selling, General, and Administrative Costs: AMETEK, Inc. vs EMCOR Group, Inc.
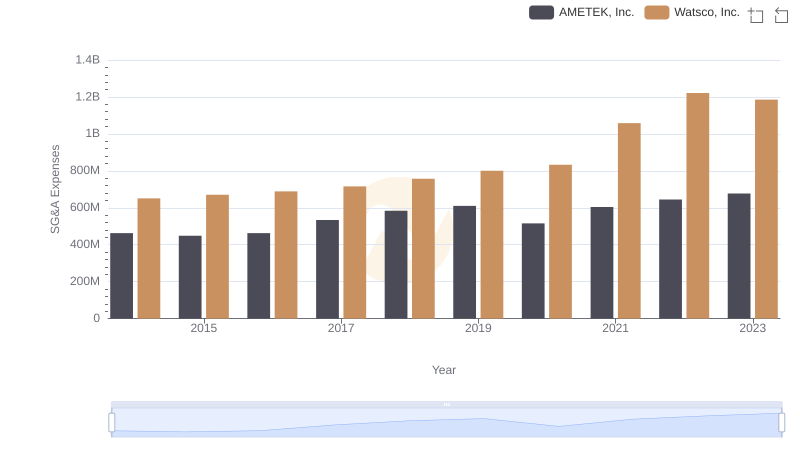
Comparing SG&A Expenses: AMETEK, Inc. vs Watsco, Inc. Trends and Insights
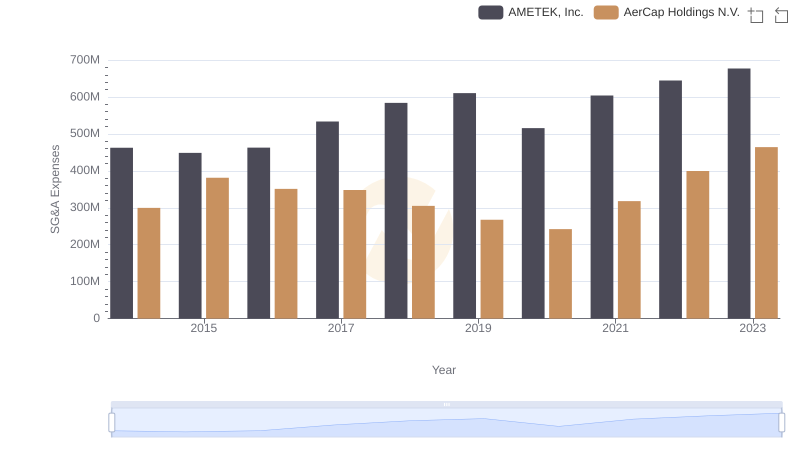
Selling, General, and Administrative Costs: AMETEK, Inc. vs AerCap Holdings N.V.
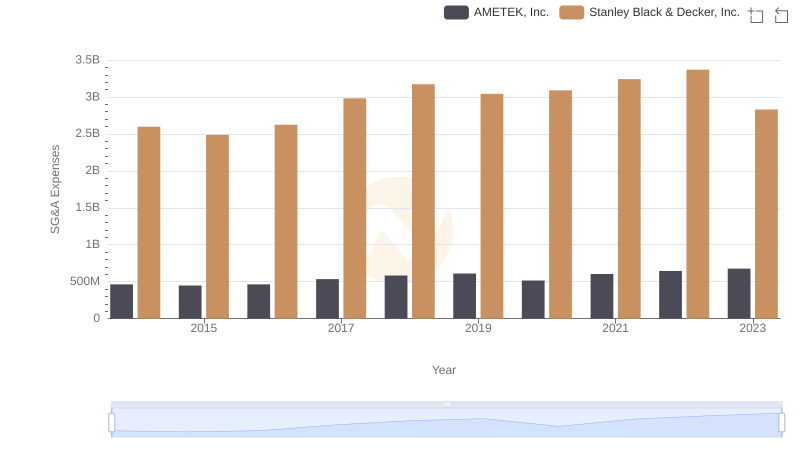
AMETEK, Inc. and Stanley Black & Decker, Inc.: SG&A Spending Patterns Compared