| __timestamp | AMETEK, Inc. | EMCOR Group, Inc. |
|---|---|---|
| Wednesday, January 1, 2014 | 462637000 | 626478000 |
| Thursday, January 1, 2015 | 448592000 | 656573000 |
| Friday, January 1, 2016 | 462970000 | 725538000 |
| Sunday, January 1, 2017 | 533645000 | 757062000 |
| Monday, January 1, 2018 | 584022000 | 799157000 |
| Tuesday, January 1, 2019 | 610280000 | 893453000 |
| Wednesday, January 1, 2020 | 515630000 | 903584000 |
| Friday, January 1, 2021 | 603944000 | 970937000 |
| Saturday, January 1, 2022 | 644577000 | 1038717000 |
| Sunday, January 1, 2023 | 677006000 | 1211233000 |
| Monday, January 1, 2024 | 696905000 |
Igniting the spark of knowledge
In the ever-evolving landscape of corporate America, understanding the financial dynamics of industry leaders is crucial. Over the past decade, AMETEK, Inc. and EMCOR Group, Inc. have showcased intriguing trends in their Selling, General, and Administrative (SG&A) expenses. From 2014 to 2023, EMCOR consistently outpaced AMETEK, with SG&A costs growing by approximately 93%, compared to AMETEK's 46% increase. This disparity highlights EMCOR's aggressive expansion and operational strategies.
By 2023, EMCOR's SG&A expenses reached a staggering 1.2 billion, nearly double that of AMETEK's 677 million. This trend underscores EMCOR's robust growth trajectory, possibly driven by its diversified service offerings and strategic acquisitions. Meanwhile, AMETEK's steady rise reflects its focus on efficiency and innovation. As these giants continue to evolve, their financial strategies offer valuable insights into the broader economic landscape.
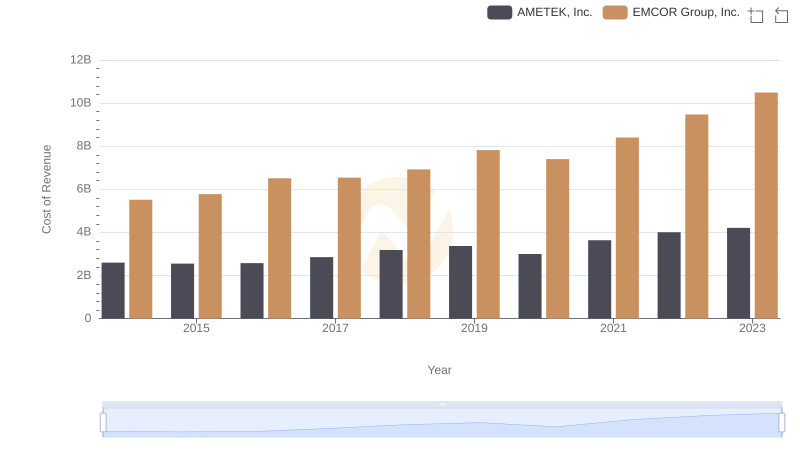
Cost of Revenue Trends: AMETEK, Inc. vs EMCOR Group, Inc.

Gross Profit Trends Compared: AMETEK, Inc. vs EMCOR Group, Inc.
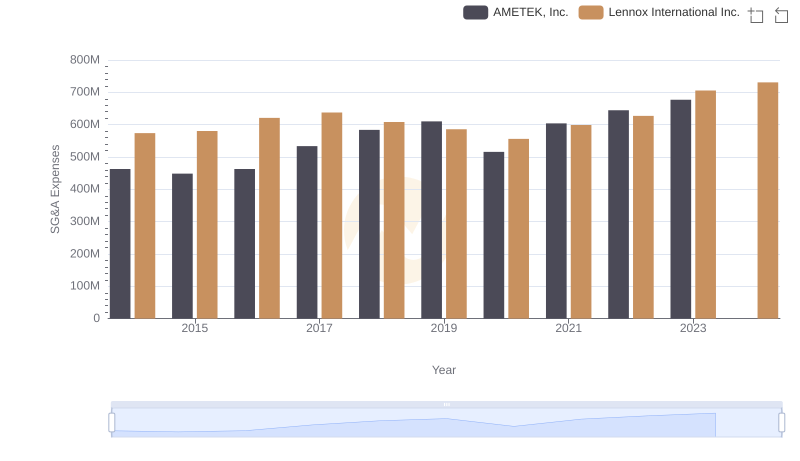
AMETEK, Inc. or Lennox International Inc.: Who Manages SG&A Costs Better?
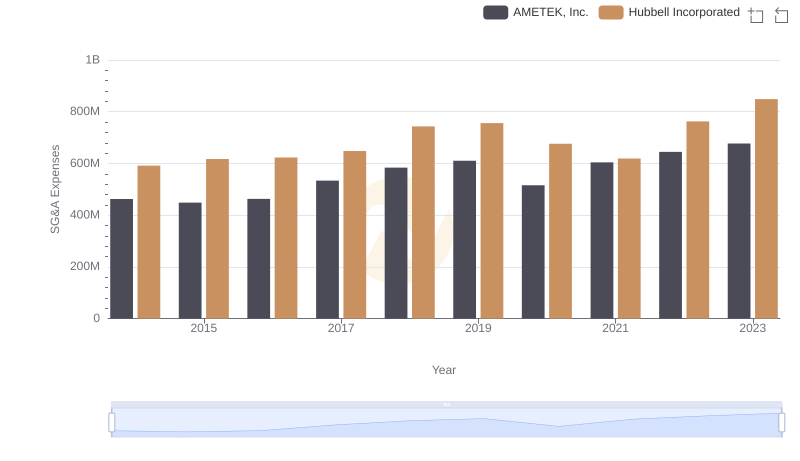
Breaking Down SG&A Expenses: AMETEK, Inc. vs Hubbell Incorporated
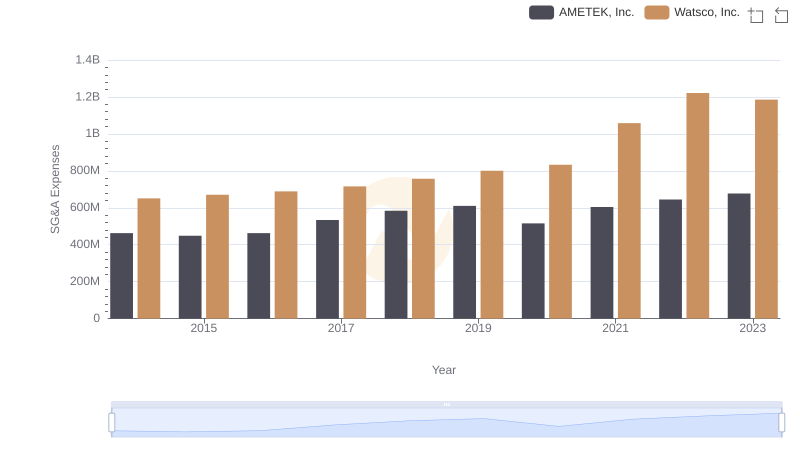
Comparing SG&A Expenses: AMETEK, Inc. vs Watsco, Inc. Trends and Insights
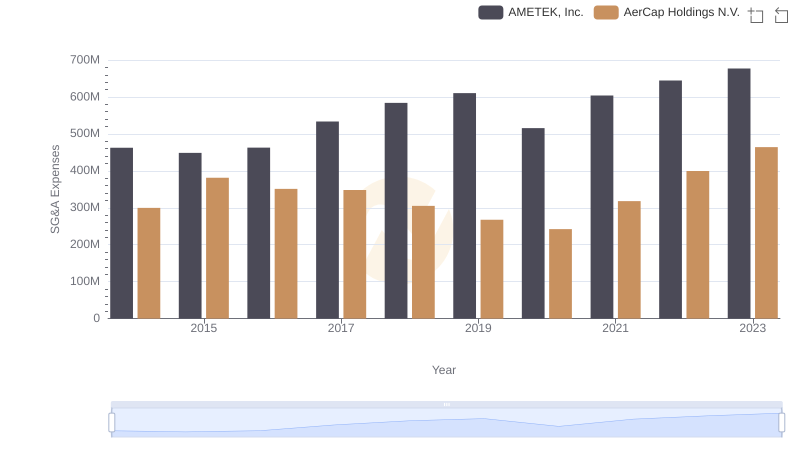
Selling, General, and Administrative Costs: AMETEK, Inc. vs AerCap Holdings N.V.
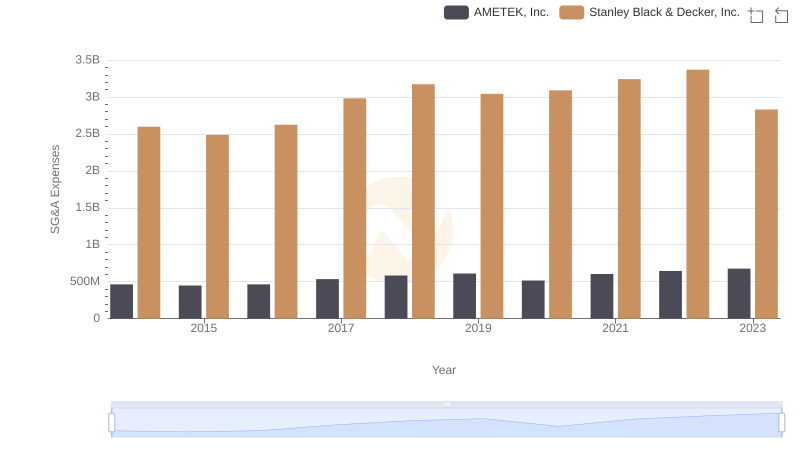
AMETEK, Inc. and Stanley Black & Decker, Inc.: SG&A Spending Patterns Compared

AMETEK, Inc. or TransUnion: Who Manages SG&A Costs Better?