| __timestamp | AMETEK, Inc. | Watsco, Inc. |
|---|---|---|
| Wednesday, January 1, 2014 | 1424947000 | 956402000 |
| Thursday, January 1, 2015 | 1425015000 | 1007357000 |
| Friday, January 1, 2016 | 1264867000 | 1034584000 |
| Sunday, January 1, 2017 | 1448739000 | 1065659000 |
| Monday, January 1, 2018 | 1659562000 | 1120252000 |
| Tuesday, January 1, 2019 | 1787660000 | 1156956000 |
| Wednesday, January 1, 2020 | 1543514000 | 1222821000 |
| Friday, January 1, 2021 | 1912614000 | 1667545000 |
| Saturday, January 1, 2022 | 2145269000 | 2030289000 |
| Sunday, January 1, 2023 | 2384465001 | 1992140000 |
| Monday, January 1, 2024 | 6941180000 | 2044713000 |
Infusing magic into the data realm
In the competitive landscape of industrial manufacturing and distribution, AMETEK, Inc. and Watsco, Inc. have emerged as formidable players. Over the past decade, AMETEK has consistently outperformed Watsco in terms of gross profit, showcasing a robust growth trajectory. From 2014 to 2023, AMETEK's gross profit surged by approximately 67%, peaking in 2023. In contrast, Watsco experienced a 108% increase, with its highest gross profit recorded in 2022. This performance highlights AMETEK's strategic prowess in maintaining a steady upward trend, while Watsco's growth, though impressive, faced a slight dip in 2023. The data underscores the resilience and adaptability of these companies in navigating economic challenges and capitalizing on market opportunities. As we look to the future, the question remains: will AMETEK continue its dominance, or will Watsco reclaim its peak performance?
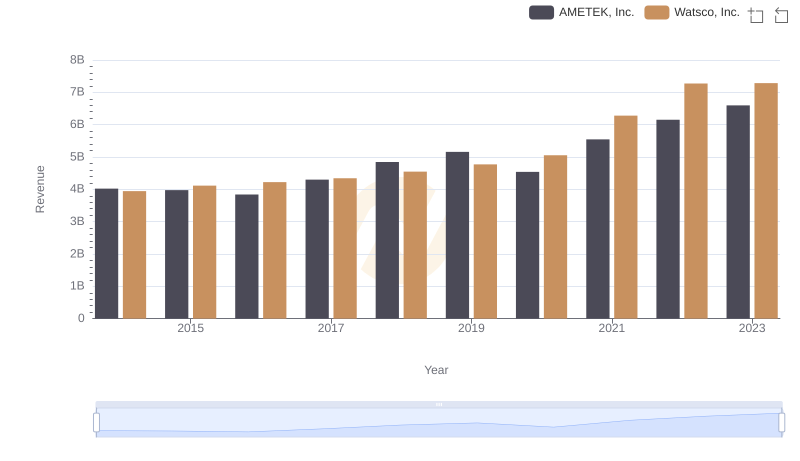
Comparing Revenue Performance: AMETEK, Inc. or Watsco, Inc.?
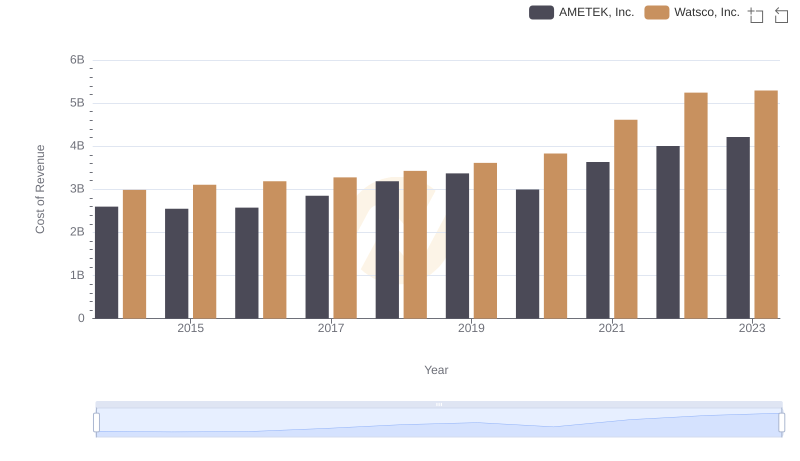
Comparing Cost of Revenue Efficiency: AMETEK, Inc. vs Watsco, Inc.
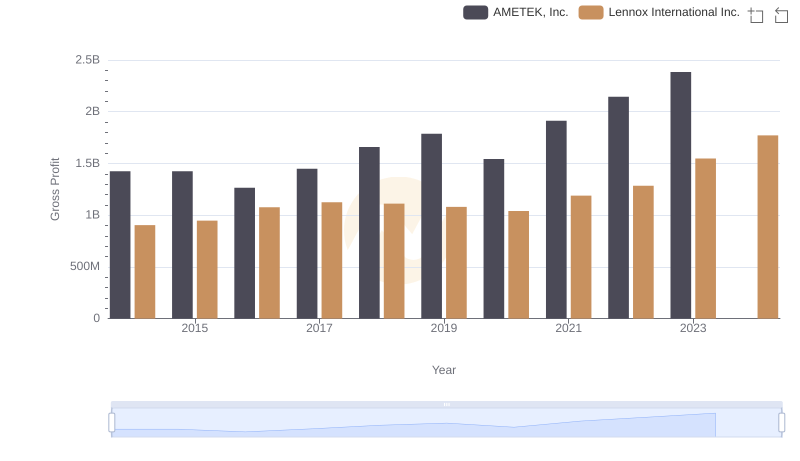
Gross Profit Analysis: Comparing AMETEK, Inc. and Lennox International Inc.
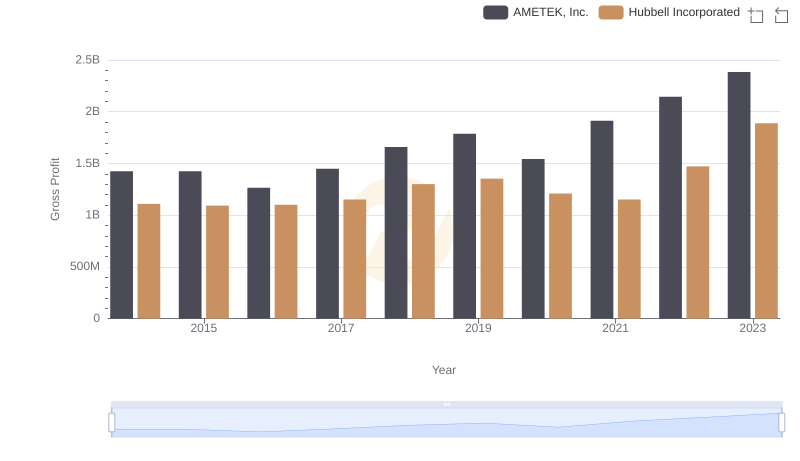
Gross Profit Analysis: Comparing AMETEK, Inc. and Hubbell Incorporated
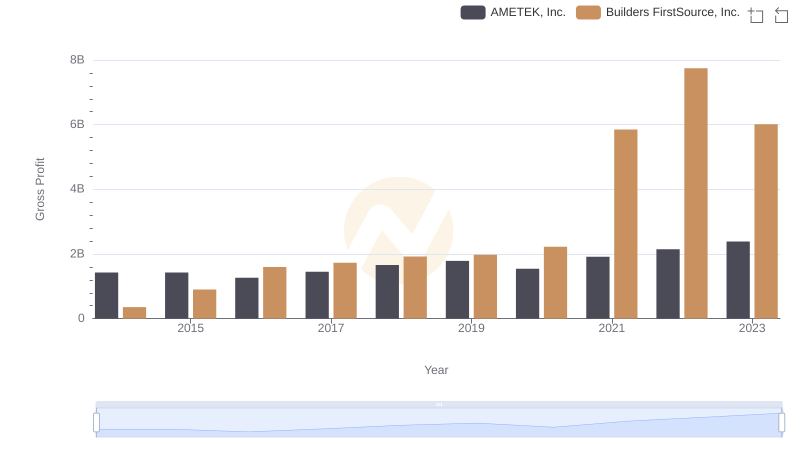
Gross Profit Trends Compared: AMETEK, Inc. vs Builders FirstSource, Inc.

Gross Profit Trends Compared: AMETEK, Inc. vs EMCOR Group, Inc.
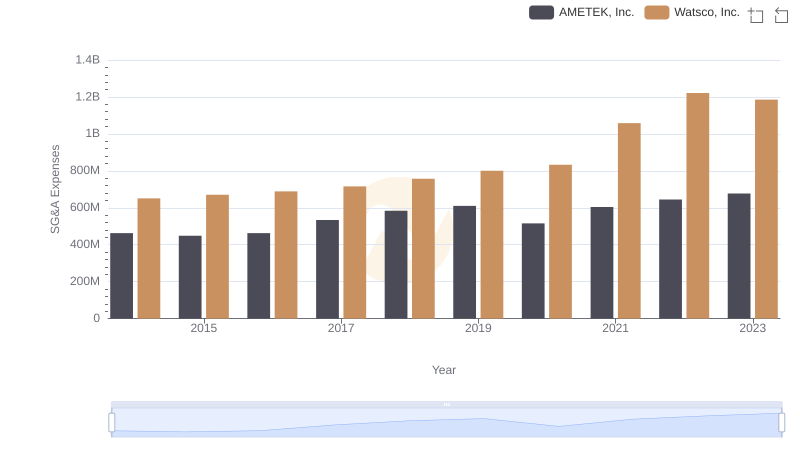
Comparing SG&A Expenses: AMETEK, Inc. vs Watsco, Inc. Trends and Insights