| __timestamp | AMETEK, Inc. | Watsco, Inc. |
|---|---|---|
| Wednesday, January 1, 2014 | 2597017000 | 2988138000 |
| Thursday, January 1, 2015 | 2549280000 | 3105882000 |
| Friday, January 1, 2016 | 2575220000 | 3186118000 |
| Sunday, January 1, 2017 | 2851431000 | 3276296000 |
| Monday, January 1, 2018 | 3186310000 | 3426401000 |
| Tuesday, January 1, 2019 | 3370897000 | 3613406000 |
| Wednesday, January 1, 2020 | 2996515000 | 3832107000 |
| Friday, January 1, 2021 | 3633900000 | 4612647000 |
| Saturday, January 1, 2022 | 4005261000 | 5244055000 |
| Sunday, January 1, 2023 | 4212484999 | 5291627000 |
| Monday, January 1, 2024 | 0 | 5573604000 |
Igniting the spark of knowledge
In the ever-evolving landscape of industrial manufacturing and distribution, cost efficiency remains a pivotal factor for success. Over the past decade, AMETEK, Inc. and Watsco, Inc. have demonstrated distinct trajectories in managing their cost of revenue. From 2014 to 2023, Watsco, Inc. consistently outpaced AMETEK, Inc. in cost efficiency, with an average cost of revenue approximately 20% higher than its competitor. Notably, Watsco's cost of revenue surged by nearly 77% from 2014 to 2023, reflecting its expansive growth strategy. Meanwhile, AMETEK, Inc. exhibited a more moderate increase of around 62% during the same period. This data underscores the strategic differences between the two companies, with Watsco's aggressive expansion contrasting with AMETEK's steady growth. As the industrial sector continues to evolve, these insights provide a window into the operational strategies that define industry leaders.
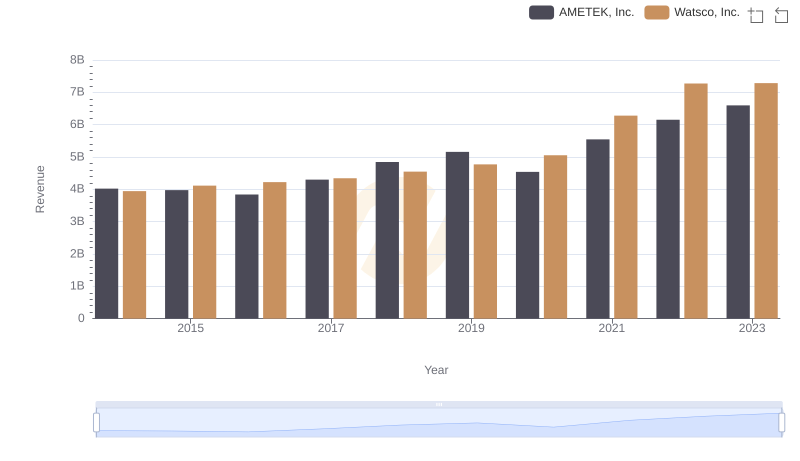
Comparing Revenue Performance: AMETEK, Inc. or Watsco, Inc.?

Cost Insights: Breaking Down AMETEK, Inc. and Hubbell Incorporated's Expenses
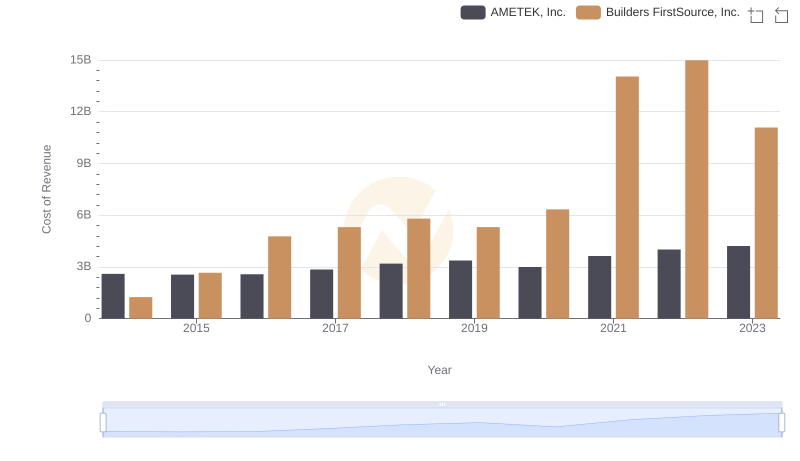
Cost of Revenue Comparison: AMETEK, Inc. vs Builders FirstSource, Inc.
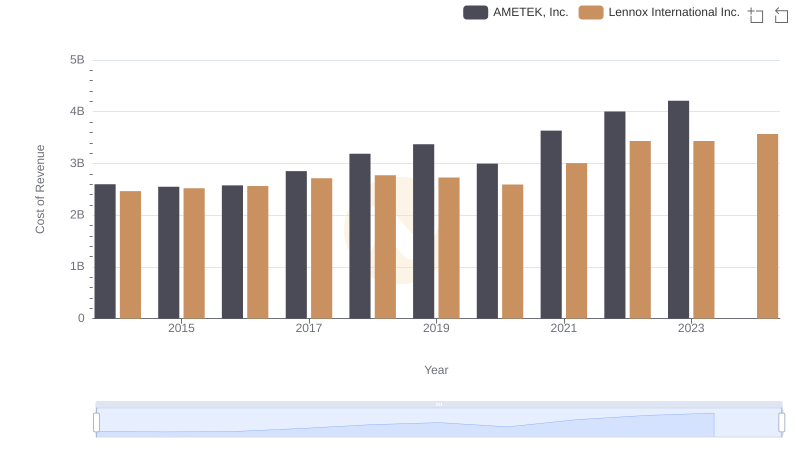
Cost of Revenue Comparison: AMETEK, Inc. vs Lennox International Inc.
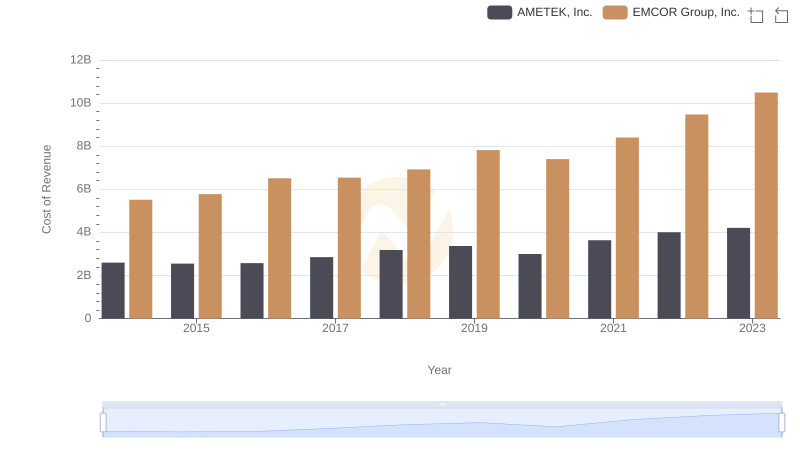
Cost of Revenue Trends: AMETEK, Inc. vs EMCOR Group, Inc.
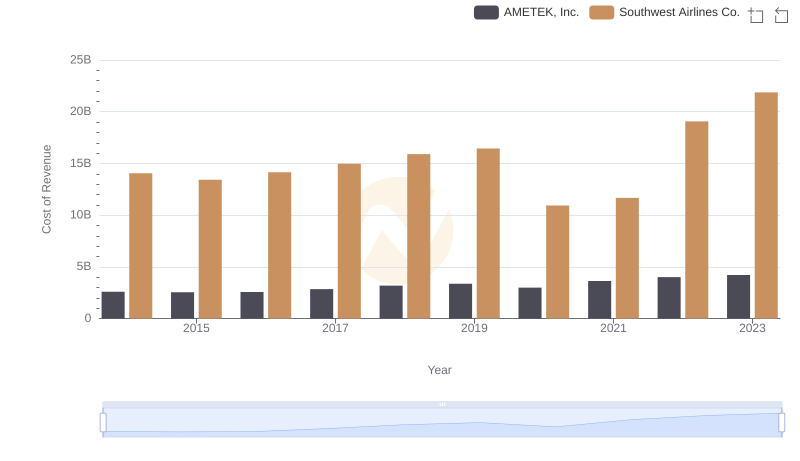
Cost Insights: Breaking Down AMETEK, Inc. and Southwest Airlines Co.'s Expenses
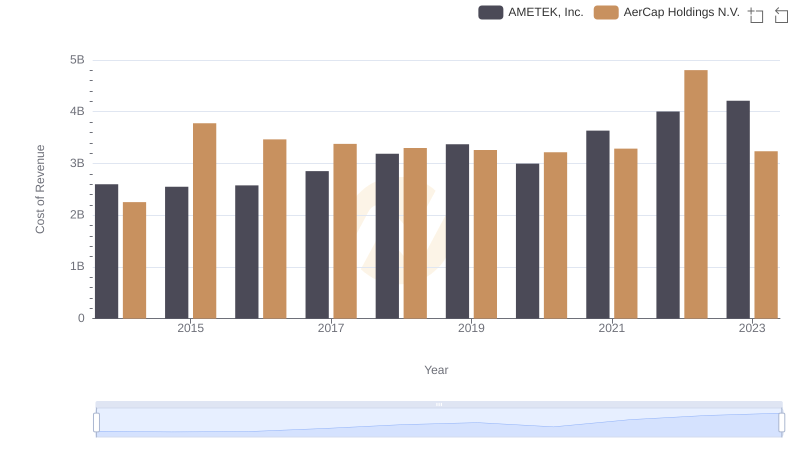
Cost of Revenue: Key Insights for AMETEK, Inc. and AerCap Holdings N.V.
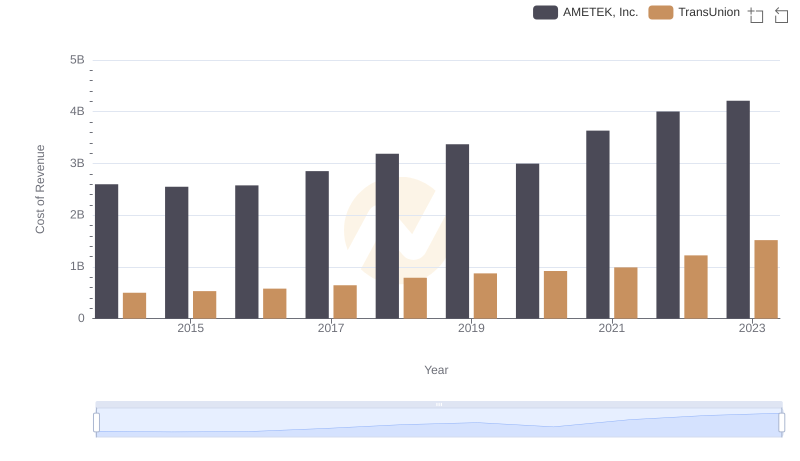
Cost of Revenue: Key Insights for AMETEK, Inc. and TransUnion
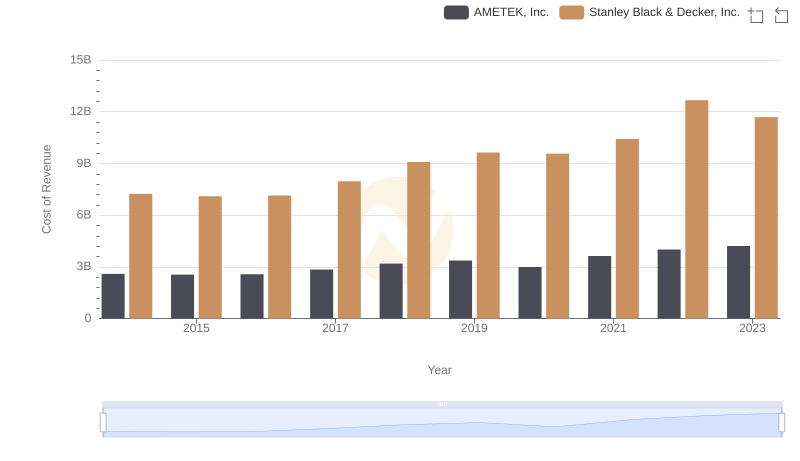
Comparing Cost of Revenue Efficiency: AMETEK, Inc. vs Stanley Black & Decker, Inc.
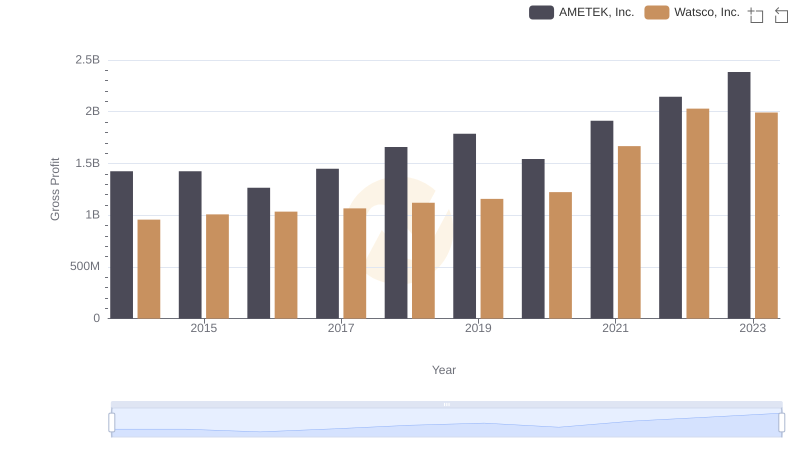
AMETEK, Inc. vs Watsco, Inc.: A Gross Profit Performance Breakdown
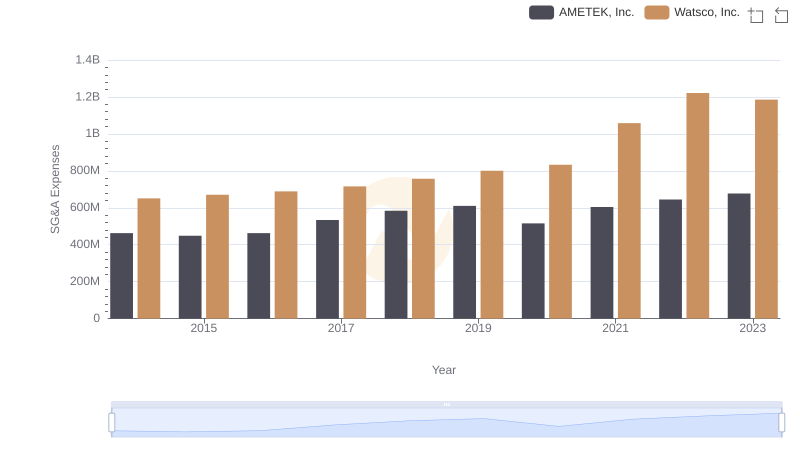
Comparing SG&A Expenses: AMETEK, Inc. vs Watsco, Inc. Trends and Insights