| __timestamp | AMETEK, Inc. | Watsco, Inc. |
|---|---|---|
| Wednesday, January 1, 2014 | 4021964000 | 3944540000 |
| Thursday, January 1, 2015 | 3974295000 | 4113239000 |
| Friday, January 1, 2016 | 3840087000 | 4220702000 |
| Sunday, January 1, 2017 | 4300170000 | 4341955000 |
| Monday, January 1, 2018 | 4845872000 | 4546653000 |
| Tuesday, January 1, 2019 | 5158557000 | 4770362000 |
| Wednesday, January 1, 2020 | 4540029000 | 5054928000 |
| Friday, January 1, 2021 | 5546514000 | 6280192000 |
| Saturday, January 1, 2022 | 6150530000 | 7274344000 |
| Sunday, January 1, 2023 | 6596950000 | 7283767000 |
| Monday, January 1, 2024 | 6941180000 | 7618317000 |
Unveiling the hidden dimensions of data
In the competitive landscape of industrial manufacturing and distribution, AMETEK, Inc. and Watsco, Inc. have demonstrated remarkable revenue trajectories over the past decade. From 2014 to 2023, both companies have shown consistent growth, with Watsco, Inc. leading the charge. By 2023, Watsco's revenue surged by approximately 85% from its 2014 figures, reaching a peak of $7.28 billion. Meanwhile, AMETEK, Inc. also experienced a robust increase, with its revenue climbing by around 64% to $6.60 billion in the same period.
The data reveals a pivotal year in 2020, where Watsco overtook AMETEK in revenue, maintaining its lead through 2023. This shift underscores Watsco's strategic positioning in the HVAC distribution market, capitalizing on increased demand. As both companies continue to innovate, their revenue performance offers valuable insights into the evolving industrial sector.
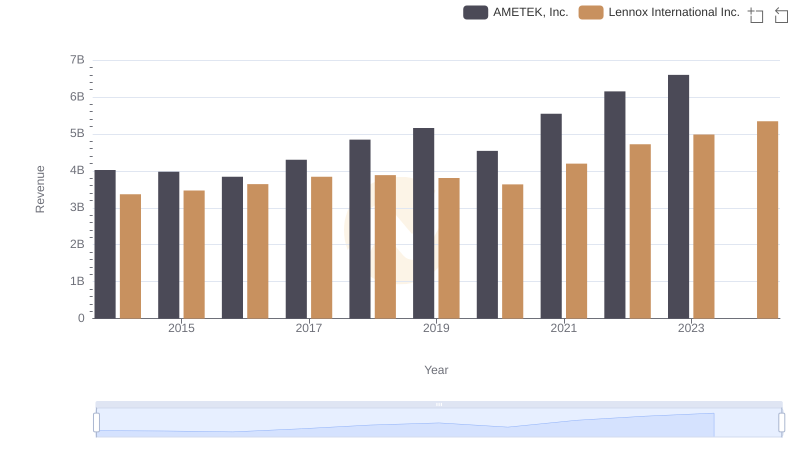
Annual Revenue Comparison: AMETEK, Inc. vs Lennox International Inc.
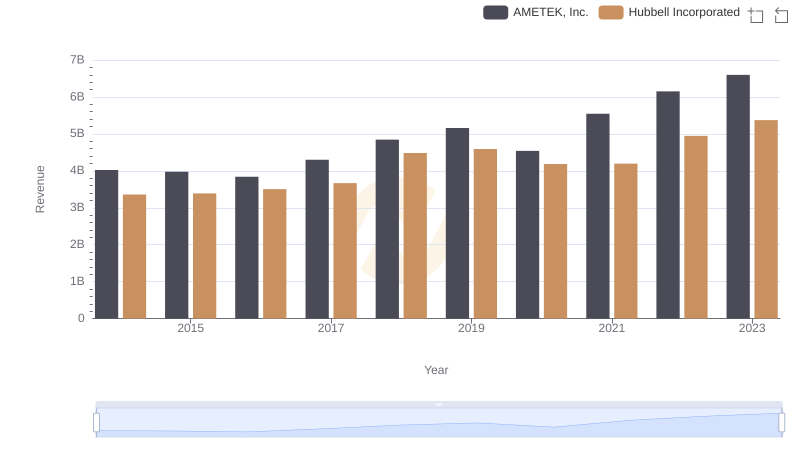
Breaking Down Revenue Trends: AMETEK, Inc. vs Hubbell Incorporated
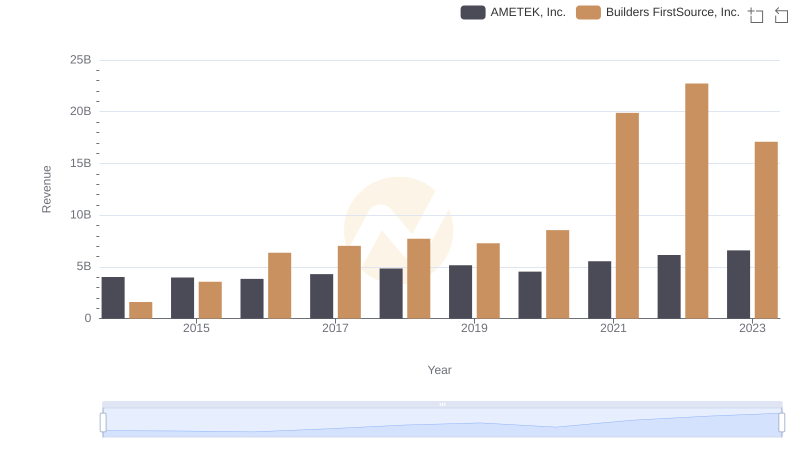
Breaking Down Revenue Trends: AMETEK, Inc. vs Builders FirstSource, Inc.
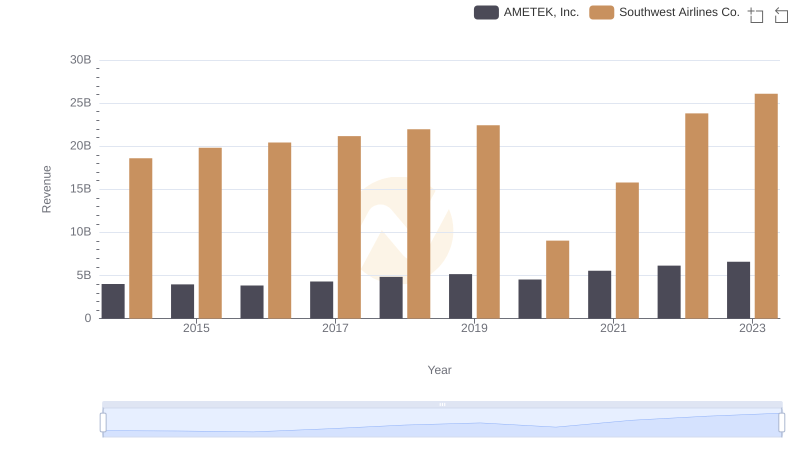
Who Generates More Revenue? AMETEK, Inc. or Southwest Airlines Co.
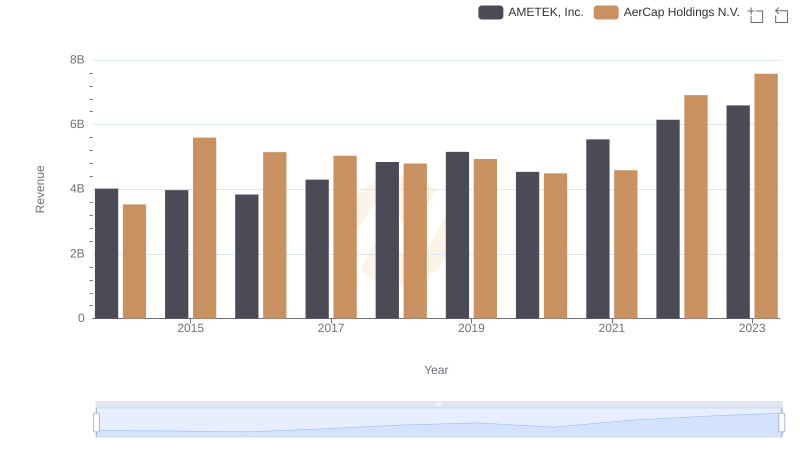
Annual Revenue Comparison: AMETEK, Inc. vs AerCap Holdings N.V.
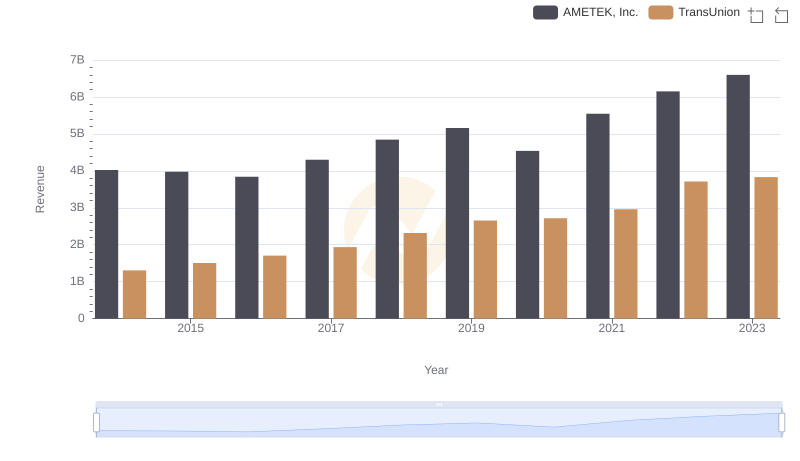
AMETEK, Inc. vs TransUnion: Examining Key Revenue Metrics

AMETEK, Inc. vs Stanley Black & Decker, Inc.: Annual Revenue Growth Compared
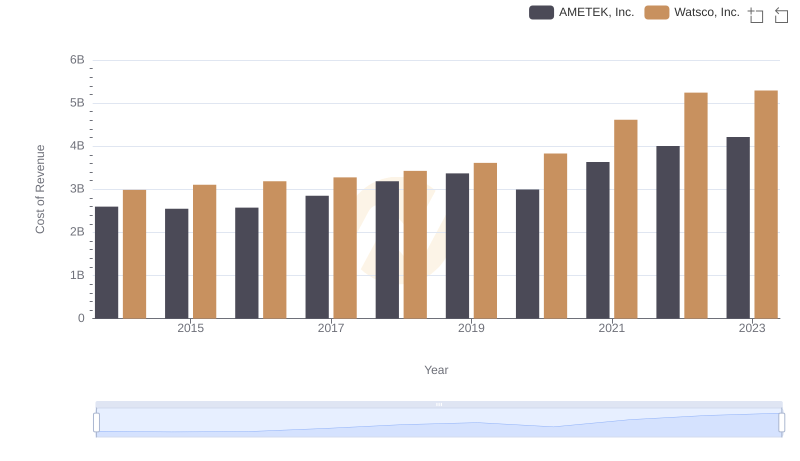
Comparing Cost of Revenue Efficiency: AMETEK, Inc. vs Watsco, Inc.
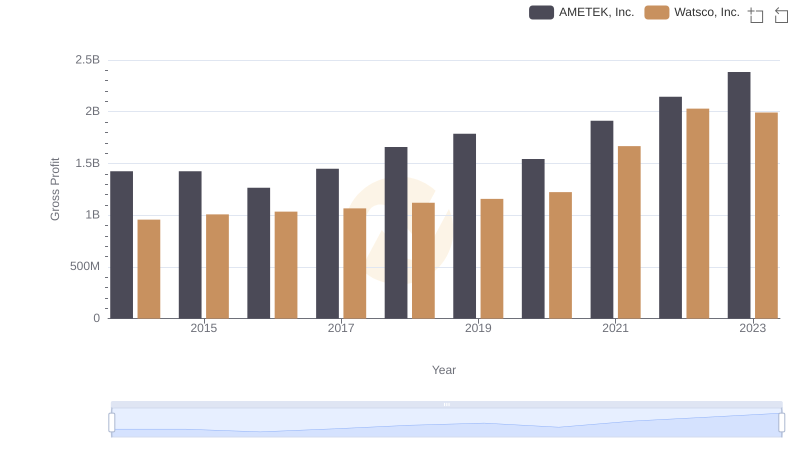
AMETEK, Inc. vs Watsco, Inc.: A Gross Profit Performance Breakdown
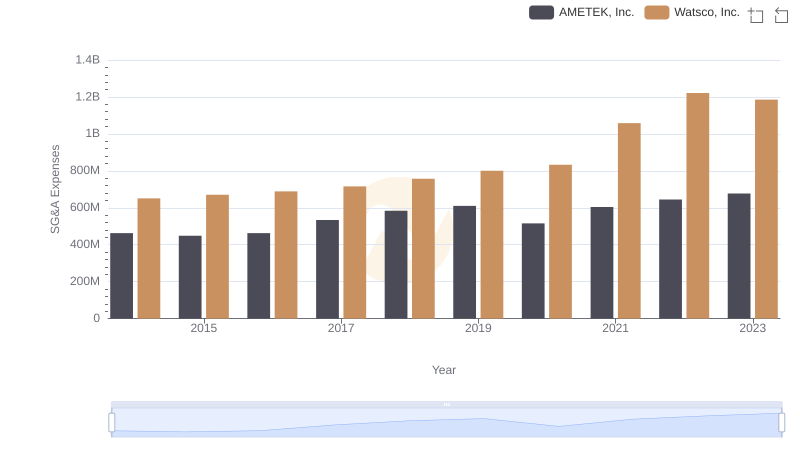
Comparing SG&A Expenses: AMETEK, Inc. vs Watsco, Inc. Trends and Insights