| __timestamp | AMETEK, Inc. | AerCap Holdings N.V. |
|---|---|---|
| Wednesday, January 1, 2014 | 462637000 | 299900000 |
| Thursday, January 1, 2015 | 448592000 | 381308000 |
| Friday, January 1, 2016 | 462970000 | 351012000 |
| Sunday, January 1, 2017 | 533645000 | 348291000 |
| Monday, January 1, 2018 | 584022000 | 305226000 |
| Tuesday, January 1, 2019 | 610280000 | 267458000 |
| Wednesday, January 1, 2020 | 515630000 | 242161000 |
| Friday, January 1, 2021 | 603944000 | 317888000 |
| Saturday, January 1, 2022 | 644577000 | 399530000 |
| Sunday, January 1, 2023 | 677006000 | 464128000 |
| Monday, January 1, 2024 | 696905000 |
Unlocking the unknown
In the ever-evolving landscape of corporate finance, understanding the nuances of Selling, General, and Administrative (SG&A) expenses is crucial. Over the past decade, AMETEK, Inc. and AerCap Holdings N.V. have showcased distinct trajectories in their SG&A expenditures. From 2014 to 2023, AMETEK's SG&A costs surged by approximately 46%, reflecting a strategic expansion and operational scaling. In contrast, AerCap Holdings experienced a more modest increase of around 55%, indicating a steady yet cautious approach to managing overheads.
This comparative analysis not only highlights the financial strategies of these industry giants but also offers a window into their future growth trajectories.
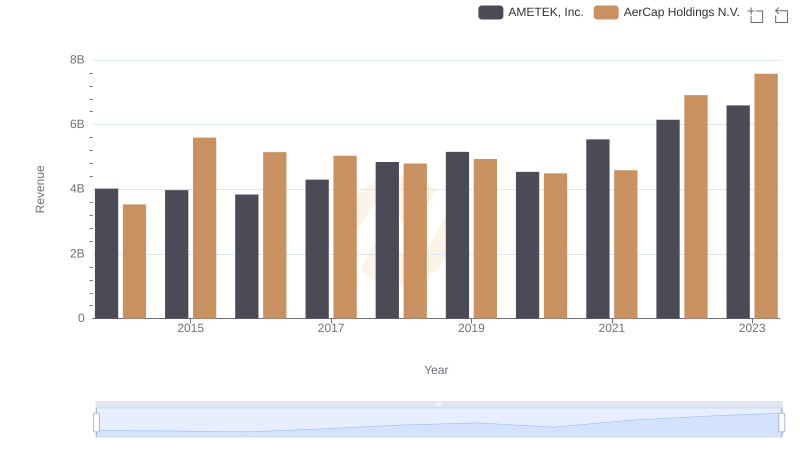
Annual Revenue Comparison: AMETEK, Inc. vs AerCap Holdings N.V.
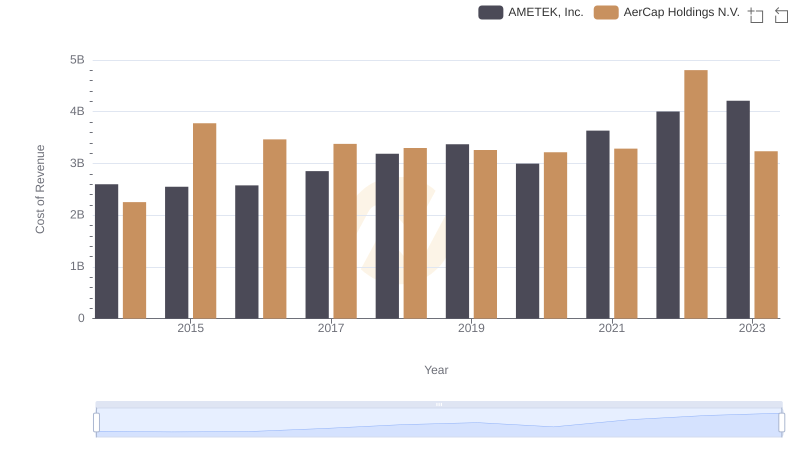
Cost of Revenue: Key Insights for AMETEK, Inc. and AerCap Holdings N.V.
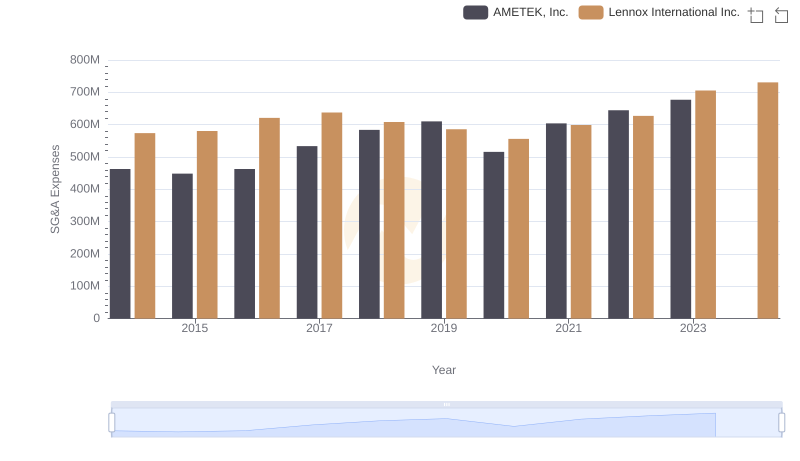
AMETEK, Inc. or Lennox International Inc.: Who Manages SG&A Costs Better?
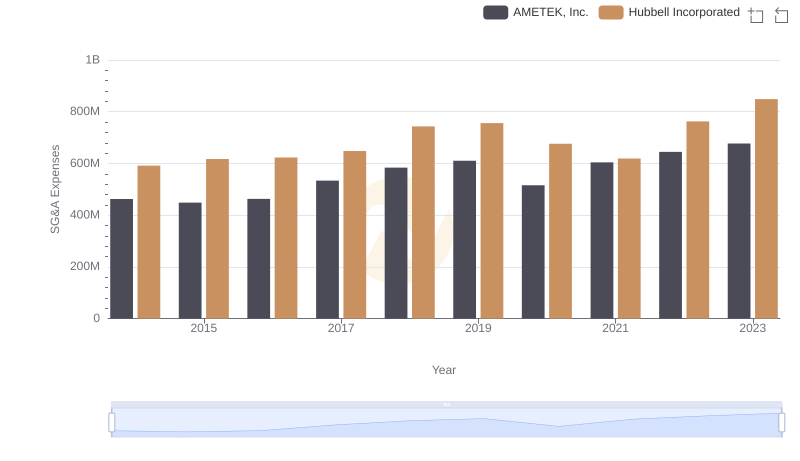
Breaking Down SG&A Expenses: AMETEK, Inc. vs Hubbell Incorporated
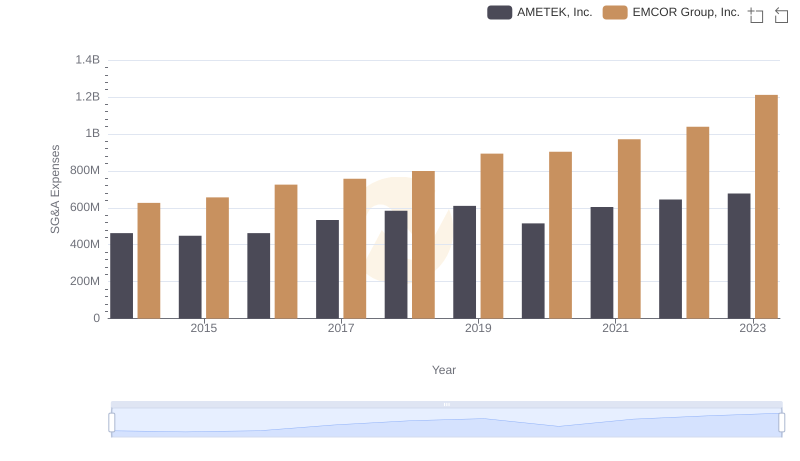
Selling, General, and Administrative Costs: AMETEK, Inc. vs EMCOR Group, Inc.
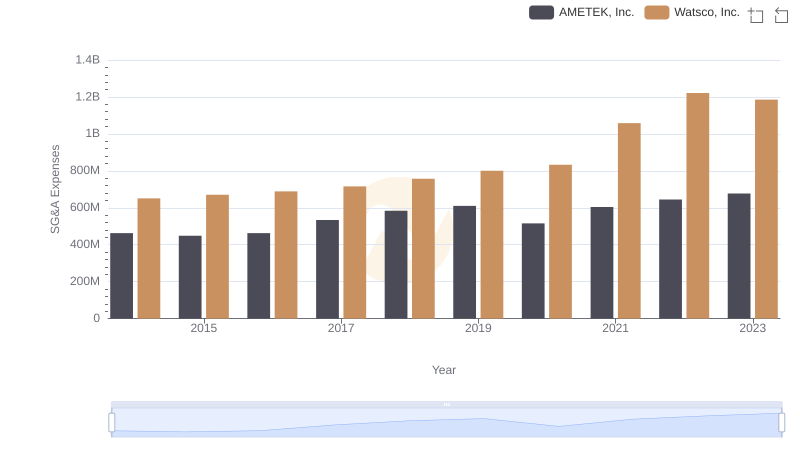
Comparing SG&A Expenses: AMETEK, Inc. vs Watsco, Inc. Trends and Insights
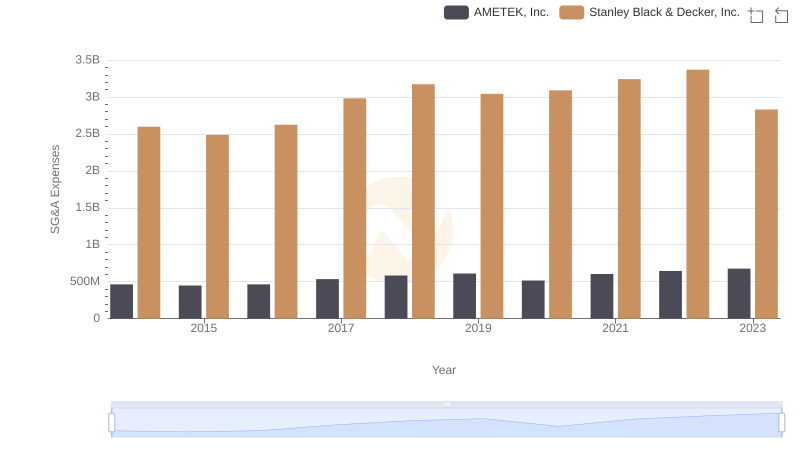
AMETEK, Inc. and Stanley Black & Decker, Inc.: SG&A Spending Patterns Compared

AMETEK, Inc. or TransUnion: Who Manages SG&A Costs Better?
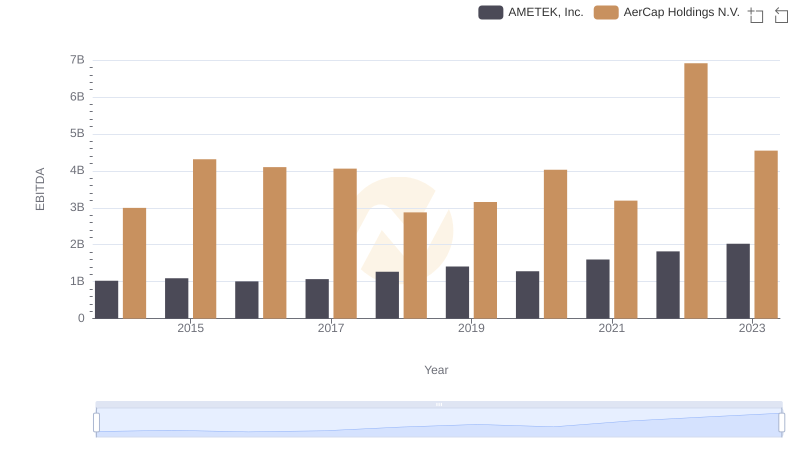
AMETEK, Inc. vs AerCap Holdings N.V.: In-Depth EBITDA Performance Comparison
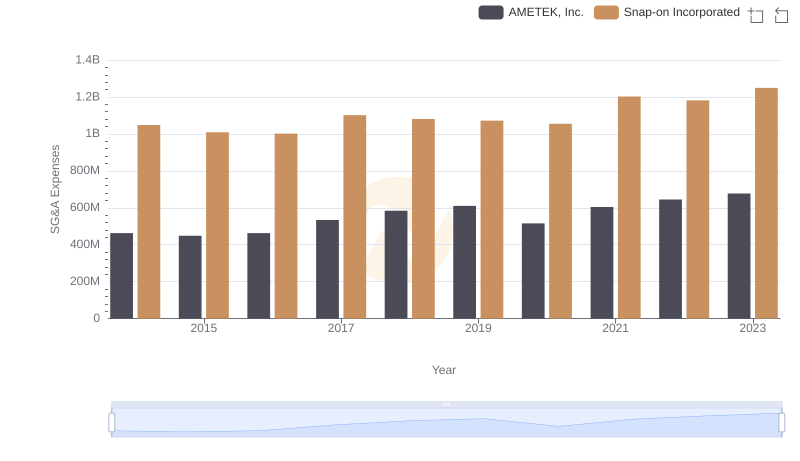
AMETEK, Inc. vs Snap-on Incorporated: SG&A Expense Trends