| __timestamp | AMETEK, Inc. | Stanley Black & Decker, Inc. |
|---|---|---|
| Wednesday, January 1, 2014 | 462637000 | 2595900000 |
| Thursday, January 1, 2015 | 448592000 | 2486400000 |
| Friday, January 1, 2016 | 462970000 | 2623900000 |
| Sunday, January 1, 2017 | 533645000 | 2980100000 |
| Monday, January 1, 2018 | 584022000 | 3171700000 |
| Tuesday, January 1, 2019 | 610280000 | 3041000000 |
| Wednesday, January 1, 2020 | 515630000 | 3089600000 |
| Friday, January 1, 2021 | 603944000 | 3240400000 |
| Saturday, January 1, 2022 | 644577000 | 3370000000 |
| Sunday, January 1, 2023 | 677006000 | 2829300000 |
| Monday, January 1, 2024 | 696905000 | 3310500000 |
Unveiling the hidden dimensions of data
In the world of industrial manufacturing, AMETEK, Inc. and Stanley Black & Decker, Inc. have long been titans. Over the past decade, their spending on Selling, General, and Administrative (SG&A) expenses reveals intriguing trends. From 2014 to 2023, AMETEK's SG&A expenses grew by approximately 46%, reflecting a strategic focus on operational efficiency and market expansion. In contrast, Stanley Black & Decker's SG&A expenses saw a more modest increase of around 9% over the same period, peaking in 2022 before a slight decline in 2023. This divergence highlights differing corporate strategies: AMETEK's aggressive growth versus Stanley Black & Decker's steady approach. As these companies navigate the ever-evolving industrial landscape, their SG&A spending patterns offer a window into their strategic priorities and market positioning.

AMETEK, Inc. vs Stanley Black & Decker, Inc.: Annual Revenue Growth Compared
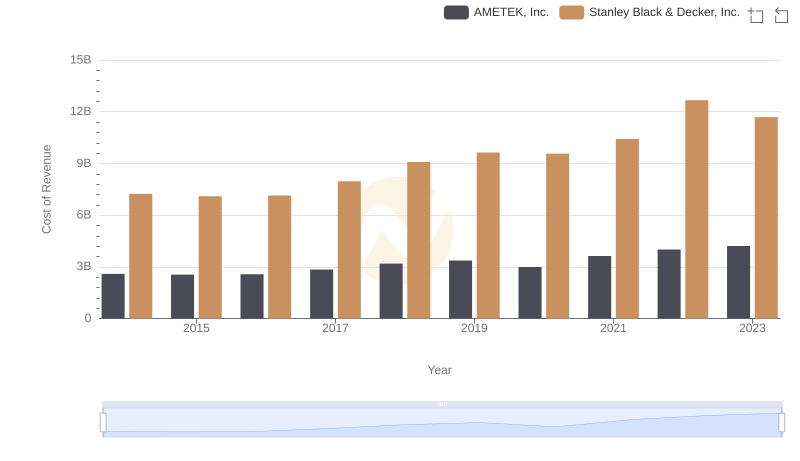
Comparing Cost of Revenue Efficiency: AMETEK, Inc. vs Stanley Black & Decker, Inc.
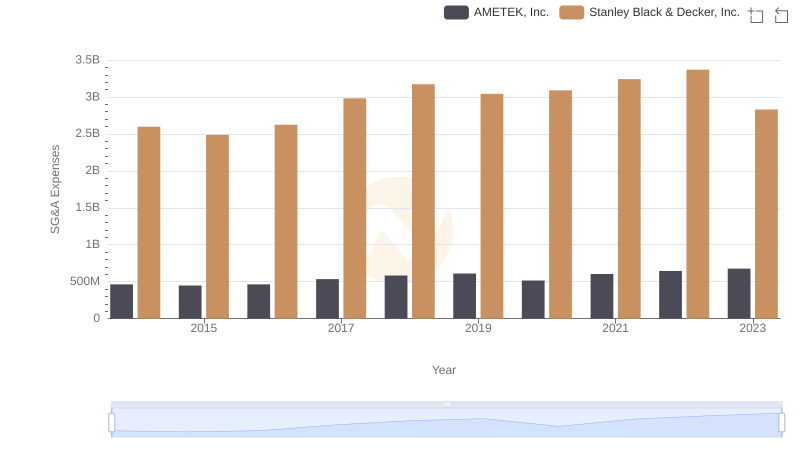
AMETEK, Inc. and Stanley Black & Decker, Inc.: SG&A Spending Patterns Compared

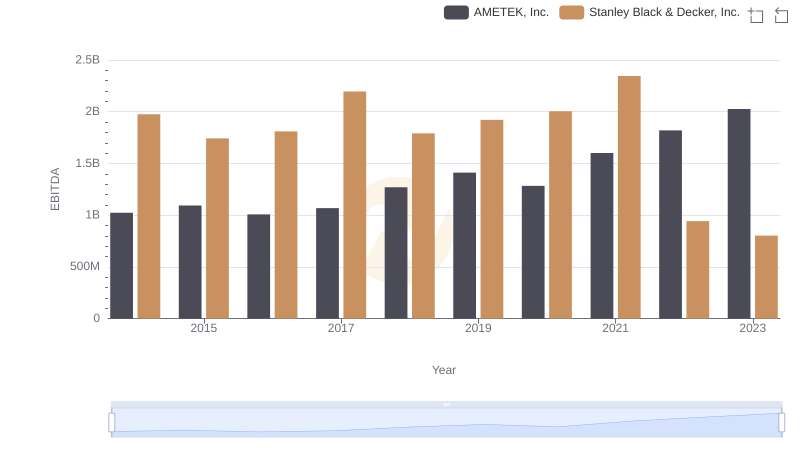
Comparative EBITDA Analysis: AMETEK, Inc. vs Stanley Black & Decker, Inc.
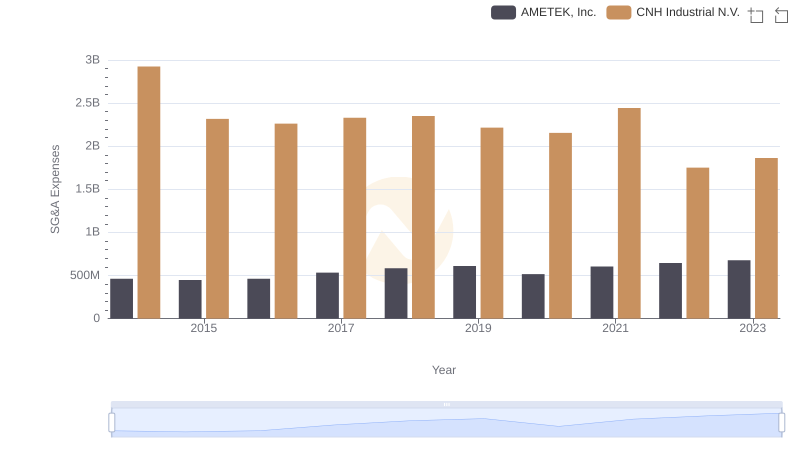
Who Optimizes SG&A Costs Better? AMETEK, Inc. or CNH Industrial N.V.
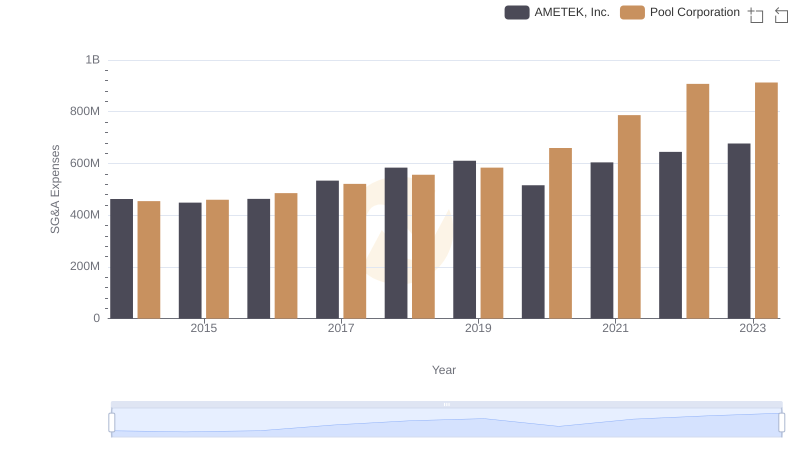
Cost Management Insights: SG&A Expenses for AMETEK, Inc. and Pool Corporation
Professional EBITDA Benchmarking: AMETEK, Inc. vs Stanley Black & Decker, Inc.