| __timestamp | AMETEK, Inc. | Allegion plc |
|---|---|---|
| Wednesday, January 1, 2014 | 1424947000 | 853700000 |
| Thursday, January 1, 2015 | 1425015000 | 869100000 |
| Friday, January 1, 2016 | 1264867000 | 985300000 |
| Sunday, January 1, 2017 | 1448739000 | 1070700000 |
| Monday, January 1, 2018 | 1659562000 | 1173300000 |
| Tuesday, January 1, 2019 | 1787660000 | 1252300000 |
| Wednesday, January 1, 2020 | 1543514000 | 1178800000 |
| Friday, January 1, 2021 | 1912614000 | 1204900000 |
| Saturday, January 1, 2022 | 2145269000 | 1322400000 |
| Sunday, January 1, 2023 | 2384465001 | 1581500000 |
| Monday, January 1, 2024 | 6941180000 | 1668500000 |
Unleashing insights
In the competitive landscape of industrial manufacturing, AMETEK, Inc. and Allegion plc have showcased remarkable growth in gross profit over the past decade. From 2014 to 2023, AMETEK's gross profit surged by approximately 67%, reaching its peak in 2023. Allegion, while trailing, demonstrated a robust 85% increase in the same period, highlighting its resilience and strategic market positioning.
AMETEK's consistent upward trajectory, with a notable dip in 2016, reflects its adaptive strategies and market expansion. Allegion, on the other hand, maintained a steady climb, with a significant leap in 2023, underscoring its innovative approach in the security solutions sector.
Both companies have navigated economic fluctuations, with AMETEK leading in absolute terms, while Allegion's growth rate suggests a promising future. This performance breakdown offers a glimpse into the dynamic industrial sector, where strategic foresight and adaptability are key.
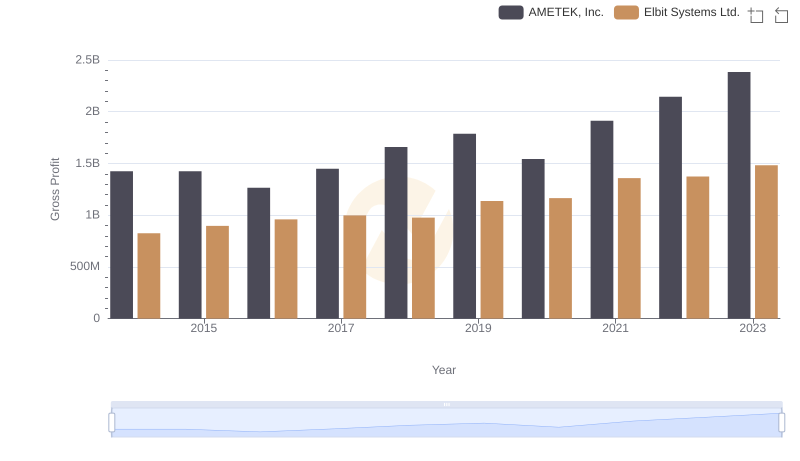
Key Insights on Gross Profit: AMETEK, Inc. vs Elbit Systems Ltd.
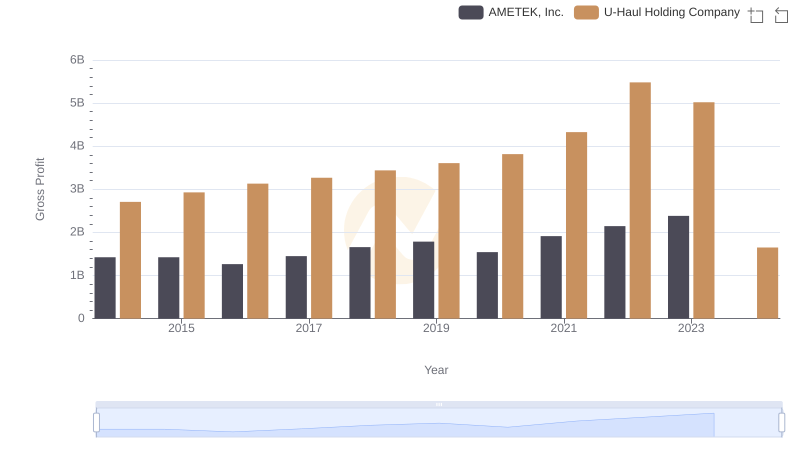
AMETEK, Inc. vs U-Haul Holding Company: A Gross Profit Performance Breakdown
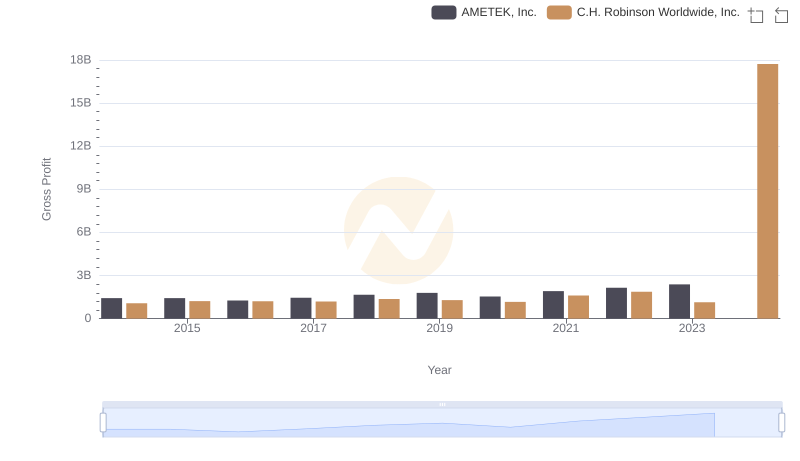
Gross Profit Analysis: Comparing AMETEK, Inc. and C.H. Robinson Worldwide, Inc.
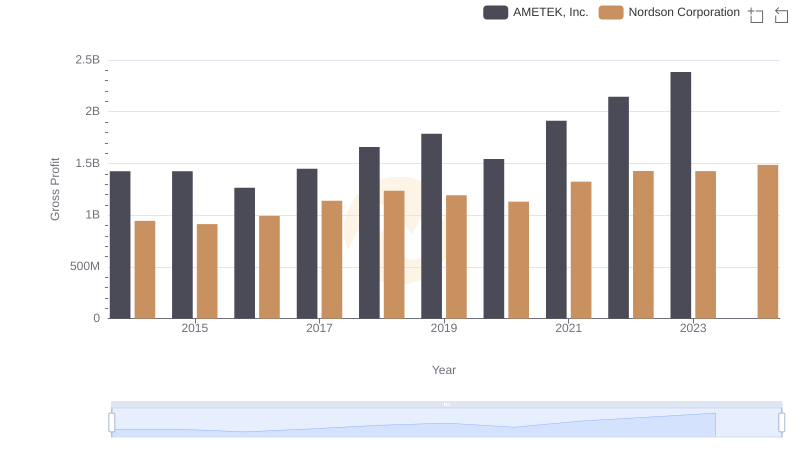
AMETEK, Inc. vs Nordson Corporation: A Gross Profit Performance Breakdown
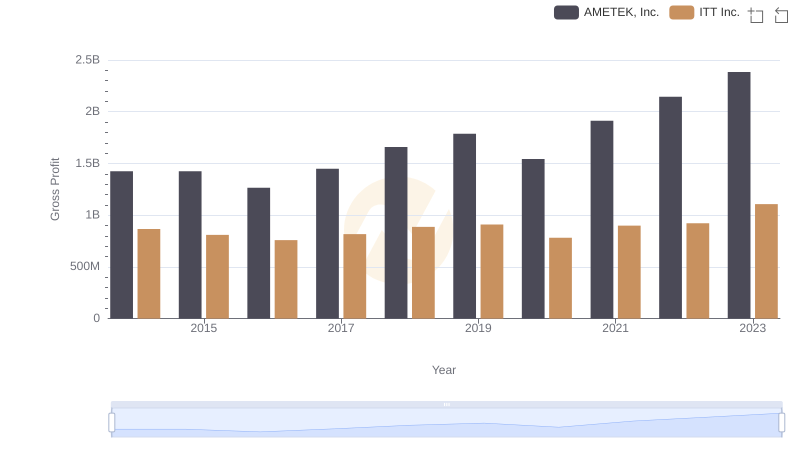
AMETEK, Inc. vs ITT Inc.: A Gross Profit Performance Breakdown
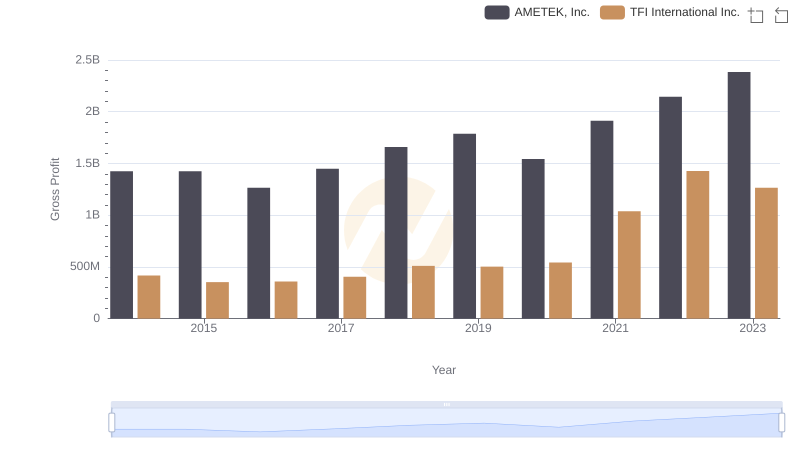
Gross Profit Trends Compared: AMETEK, Inc. vs TFI International Inc.
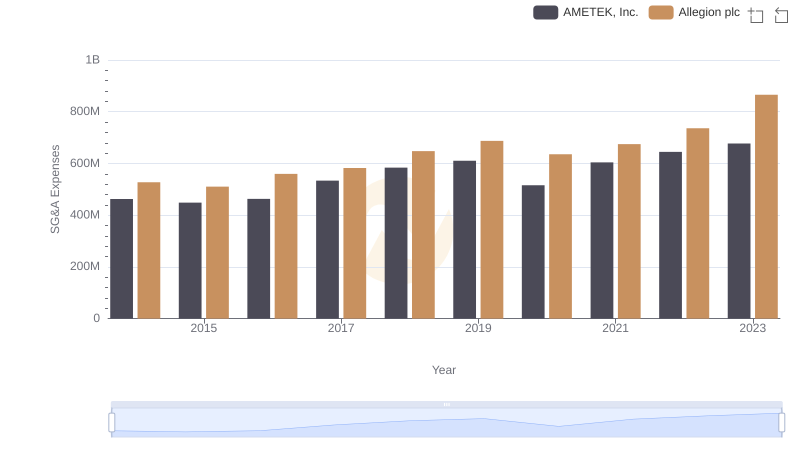
Comparing SG&A Expenses: AMETEK, Inc. vs Allegion plc Trends and Insights
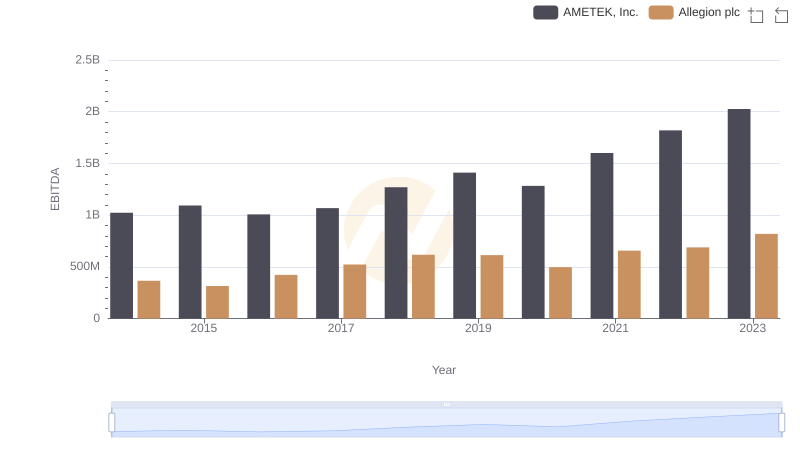
EBITDA Metrics Evaluated: AMETEK, Inc. vs Allegion plc