| __timestamp | Rockwell Automation, Inc. | TFI International Inc. |
|---|---|---|
| Wednesday, January 1, 2014 | 6623500000 | 3199928501 |
| Thursday, January 1, 2015 | 6307900000 | 2904026835 |
| Friday, January 1, 2016 | 5879500000 | 2994723606 |
| Sunday, January 1, 2017 | 6311300000 | 3770194035 |
| Monday, January 1, 2018 | 6666000000 | 3761450188 |
| Tuesday, January 1, 2019 | 6694800000 | 3964619871 |
| Wednesday, January 1, 2020 | 6329800000 | 3781134000 |
| Friday, January 1, 2021 | 6997400000 | 7220429000 |
| Saturday, January 1, 2022 | 7760400000 | 8812491000 |
| Sunday, January 1, 2023 | 9058000000 | 7521167000 |
| Monday, January 1, 2024 | 8264200000 |
Unleashing the power of data
In the ever-evolving landscape of industrial automation and logistics, Rockwell Automation, Inc. and TFI International Inc. have emerged as key players. Over the past decade, Rockwell Automation has seen a steady revenue growth, peaking in 2023 with a remarkable 30% increase from 2014. Meanwhile, TFI International's revenue trajectory has been more volatile, with a significant surge in 2021, marking a 90% increase from 2014. This growth underscores the dynamic nature of the logistics industry, driven by e-commerce and global supply chain demands. However, data for TFI International in 2024 is missing, leaving room for speculation on its future performance. As these companies navigate the challenges and opportunities of their respective industries, their revenue trends offer valuable insights into broader economic shifts and technological advancements.
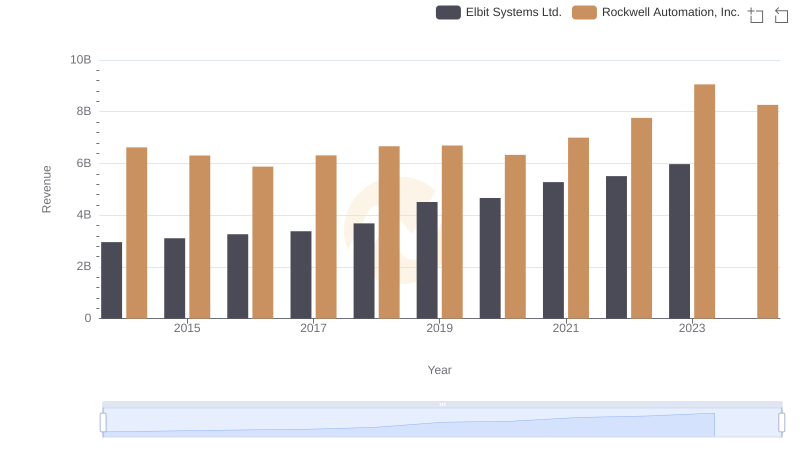
Revenue Showdown: Rockwell Automation, Inc. vs Elbit Systems Ltd.

Breaking Down Revenue Trends: Rockwell Automation, Inc. vs Curtiss-Wright Corporation
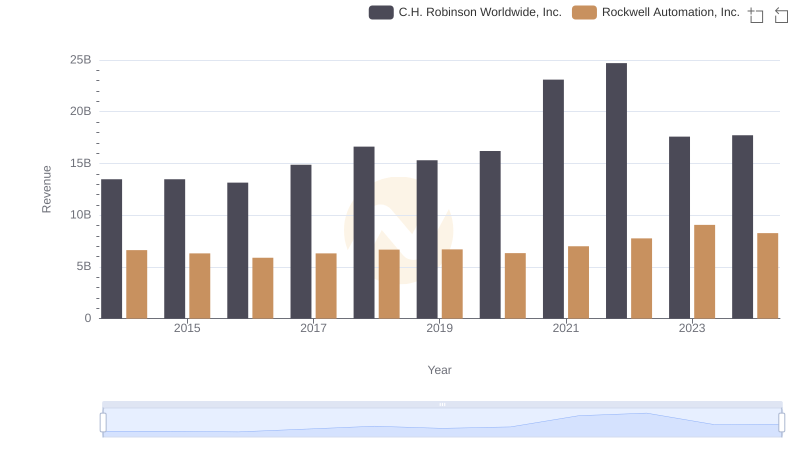
Rockwell Automation, Inc. vs C.H. Robinson Worldwide, Inc.: Annual Revenue Growth Compared
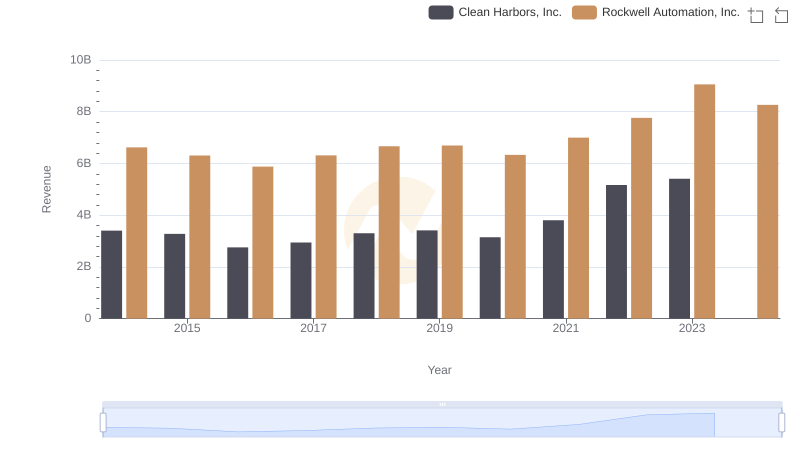
Comparing Revenue Performance: Rockwell Automation, Inc. or Clean Harbors, Inc.?
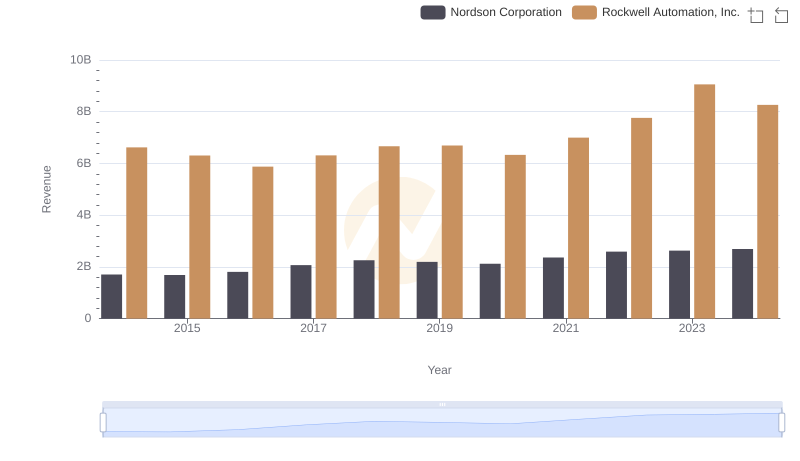
Annual Revenue Comparison: Rockwell Automation, Inc. vs Nordson Corporation
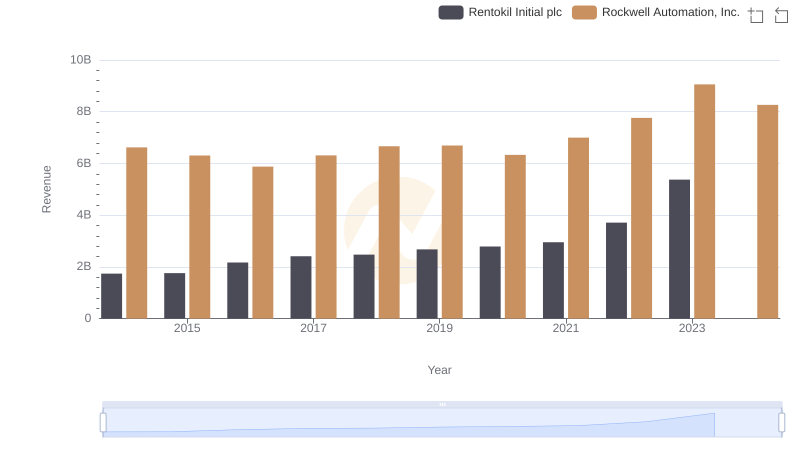
Rockwell Automation, Inc. vs Rentokil Initial plc: Examining Key Revenue Metrics
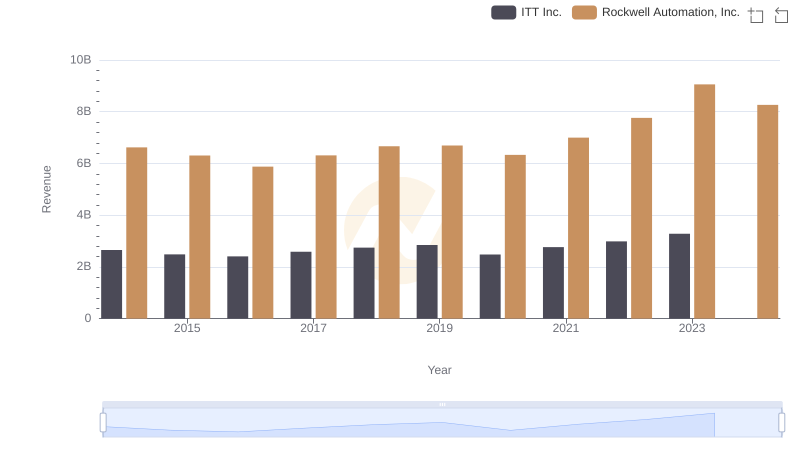
Comparing Revenue Performance: Rockwell Automation, Inc. or ITT Inc.?
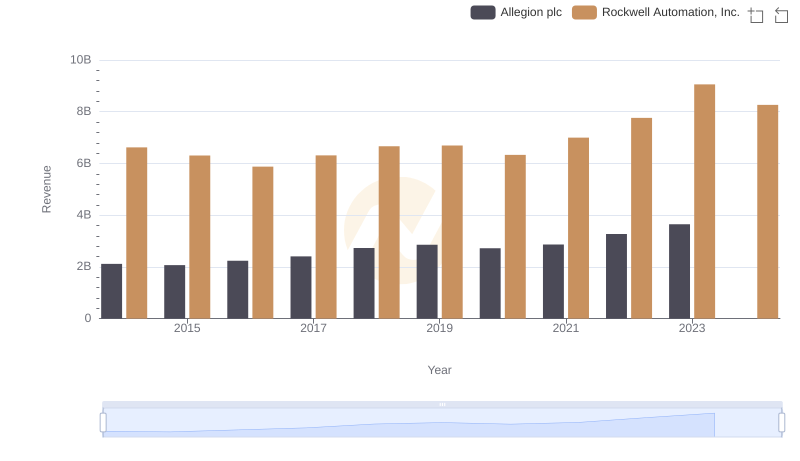
Comparing Revenue Performance: Rockwell Automation, Inc. or Allegion plc?
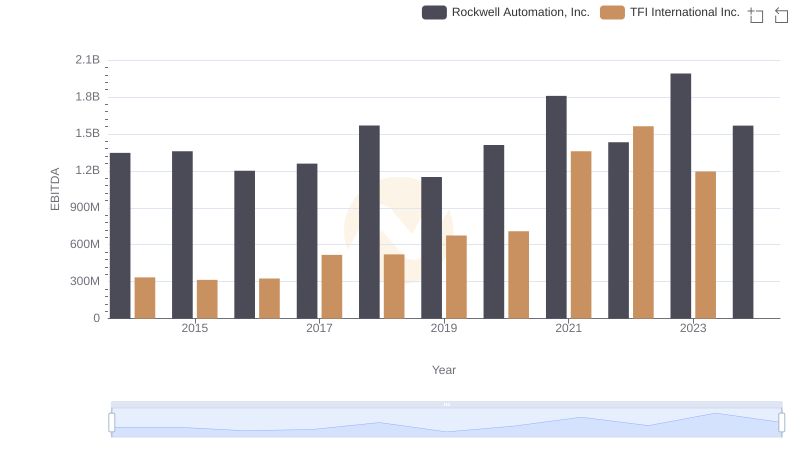
A Side-by-Side Analysis of EBITDA: Rockwell Automation, Inc. and TFI International Inc.