| __timestamp | Block, Inc. | International Business Machines Corporation |
|---|---|---|
| Wednesday, January 1, 2014 | 850192000 | 92793000000 |
| Thursday, January 1, 2015 | 1267118000 | 81742000000 |
| Friday, January 1, 2016 | 1708721000 | 79920000000 |
| Sunday, January 1, 2017 | 2214253000 | 79139000000 |
| Monday, January 1, 2018 | 3298177000 | 79591000000 |
| Tuesday, January 1, 2019 | 4713500000 | 57714000000 |
| Wednesday, January 1, 2020 | 9497578000 | 55179000000 |
| Friday, January 1, 2021 | 17661203000 | 57351000000 |
| Saturday, January 1, 2022 | 17531587000 | 60530000000 |
| Sunday, January 1, 2023 | 21915623000 | 61860000000 |
| Monday, January 1, 2024 | 62753000000 |
Unlocking the unknown
In the ever-evolving landscape of technology and finance, the revenue trajectories of International Business Machines Corporation (IBM) and Block, Inc. (formerly Square) offer a fascinating glimpse into the dynamics of industry giants and emerging disruptors. From 2014 to 2023, IBM consistently outpaced Block, Inc. in revenue generation, with IBM's revenue peaking at approximately $92.8 billion in 2014. However, Block, Inc. has shown remarkable growth, increasing its revenue by over 2,500% from 2014 to 2023, reaching around $21.9 billion.
While IBM's revenue has seen a gradual decline, dropping by about 32% over the decade, Block, Inc.'s aggressive expansion in digital payments and financial services has fueled its rapid ascent. This data underscores the shifting paradigms in the tech industry, where innovation and adaptability are key to capturing market share. Missing data for 2024 suggests the need for ongoing analysis to capture future trends.
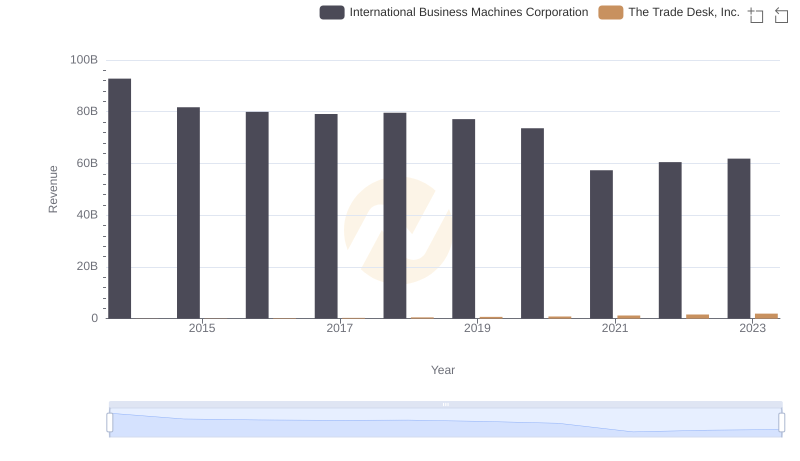
International Business Machines Corporation and The Trade Desk, Inc.: A Comprehensive Revenue Analysis
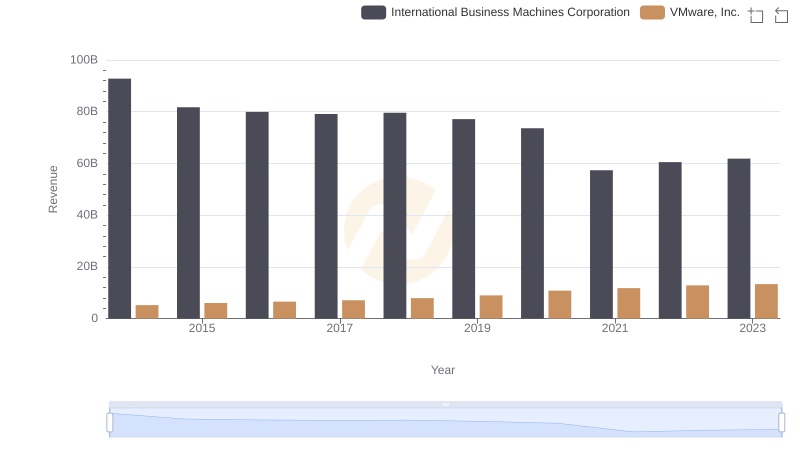
Revenue Insights: International Business Machines Corporation and VMware, Inc. Performance Compared
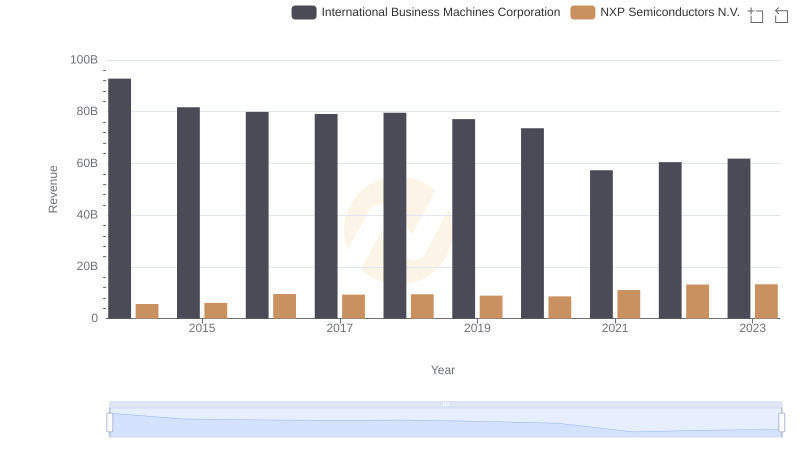
Comparing Revenue Performance: International Business Machines Corporation or NXP Semiconductors N.V.?
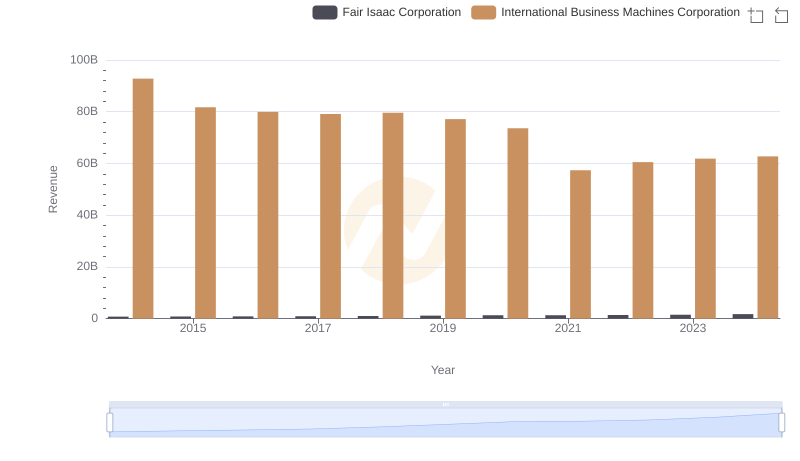
Revenue Showdown: International Business Machines Corporation vs Fair Isaac Corporation
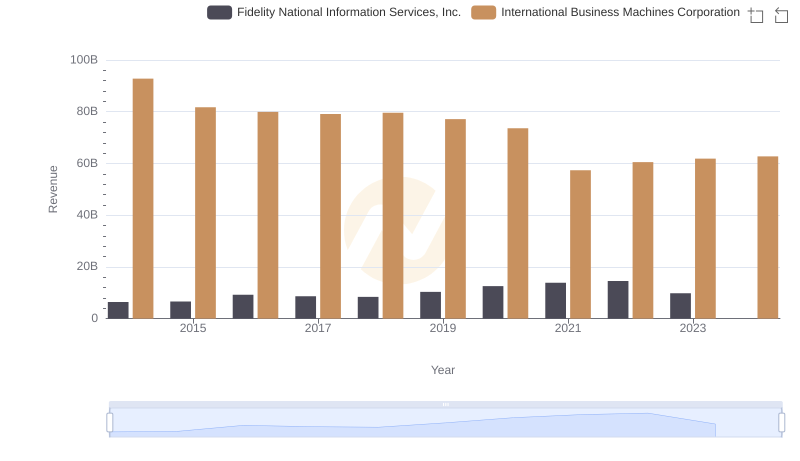
International Business Machines Corporation and Fidelity National Information Services, Inc.: A Comprehensive Revenue Analysis
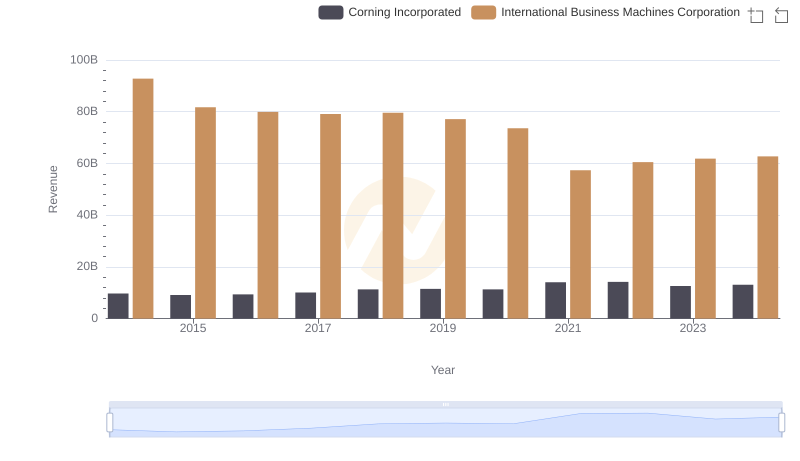
International Business Machines Corporation vs Corning Incorporated: Annual Revenue Growth Compared
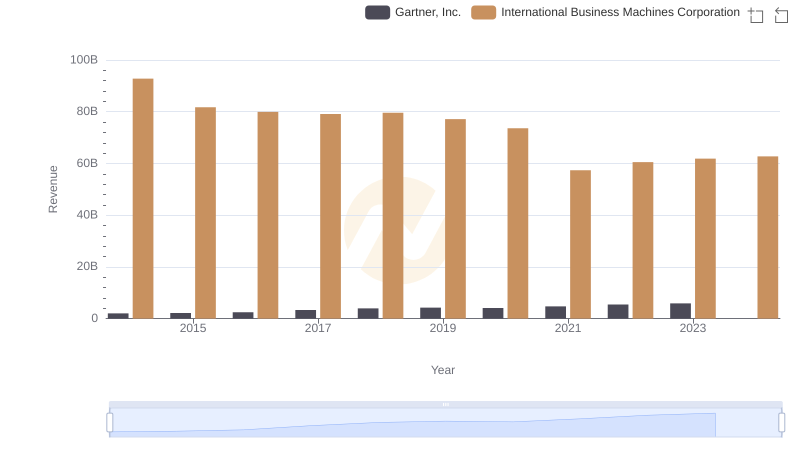
International Business Machines Corporation vs Gartner, Inc.: Examining Key Revenue Metrics
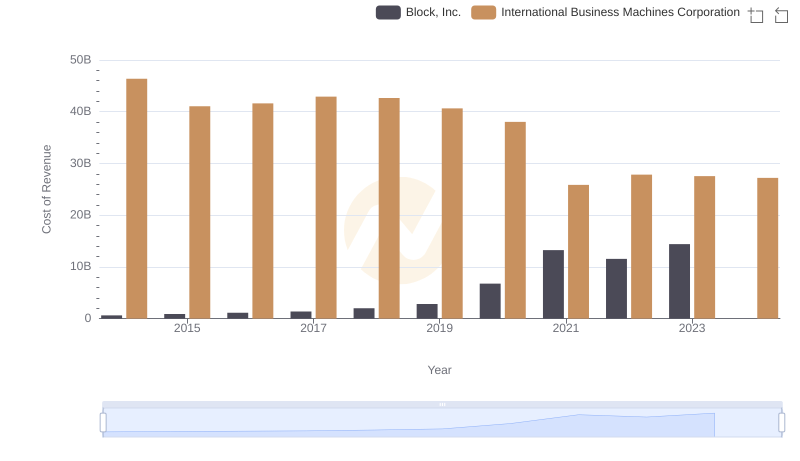
Cost Insights: Breaking Down International Business Machines Corporation and Block, Inc.'s Expenses
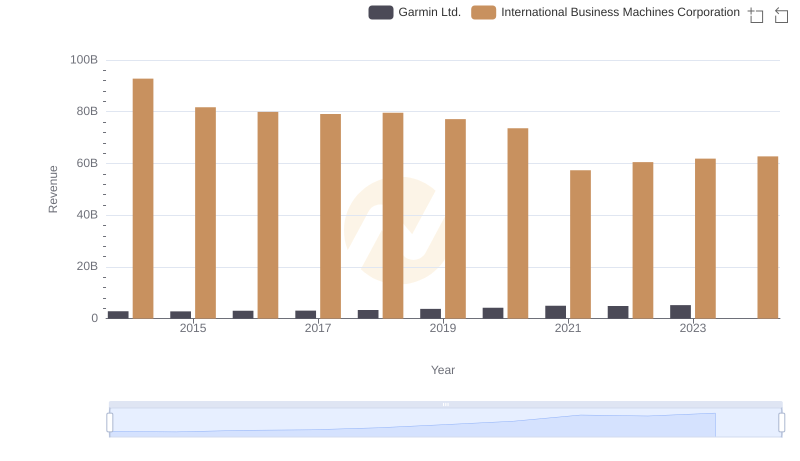
International Business Machines Corporation vs Garmin Ltd.: Examining Key Revenue Metrics
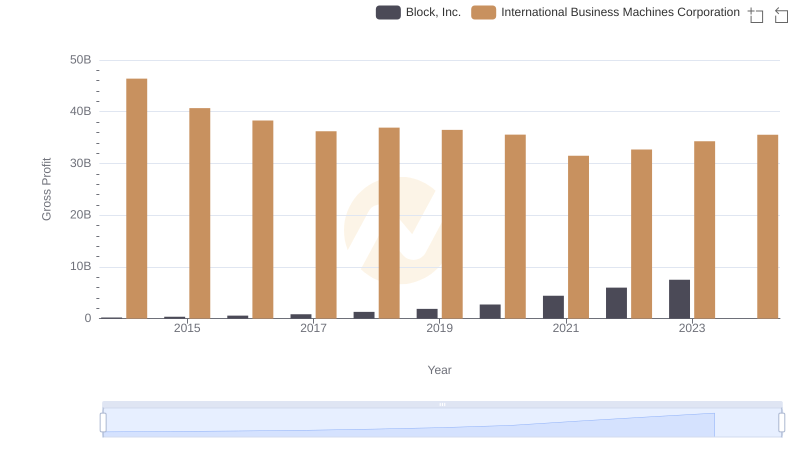
Who Generates Higher Gross Profit? International Business Machines Corporation or Block, Inc.
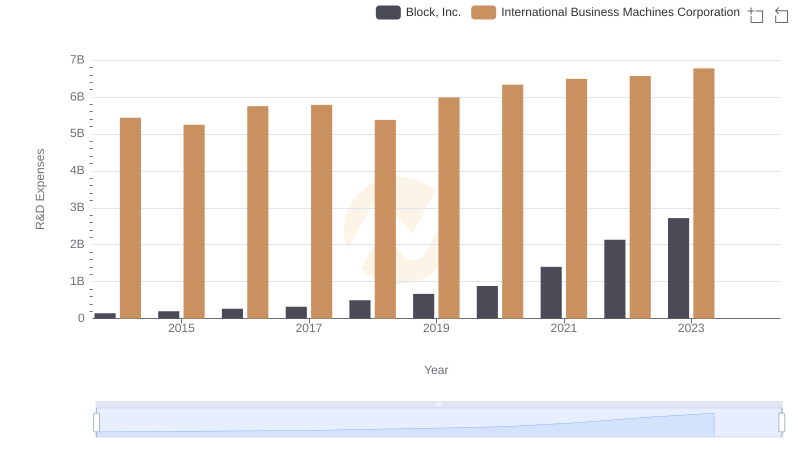
International Business Machines Corporation vs Block, Inc.: Strategic Focus on R&D Spending
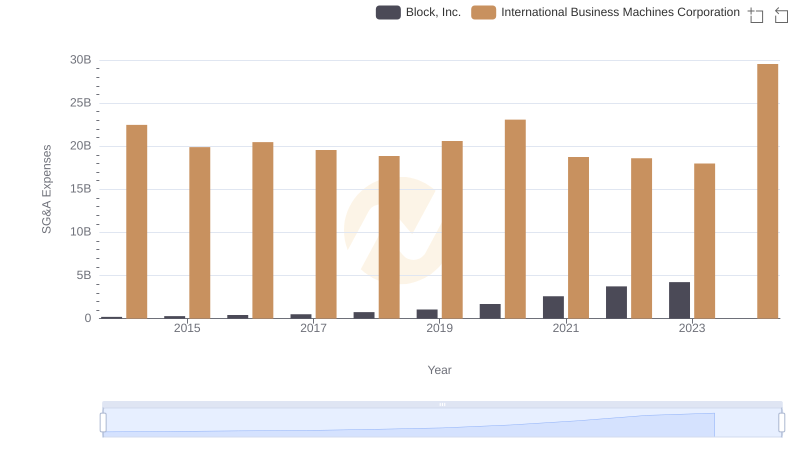
International Business Machines Corporation vs Block, Inc.: SG&A Expense Trends