| __timestamp | International Business Machines Corporation | NetEase, Inc. |
|---|---|---|
| Wednesday, January 1, 2014 | 92793000000 | 11712834000 |
| Thursday, January 1, 2015 | 81742000000 | 22802895000 |
| Friday, January 1, 2016 | 79920000000 | 38178844000 |
| Sunday, January 1, 2017 | 79139000000 | 54102019000 |
| Monday, January 1, 2018 | 79591000000 | 67156453000 |
| Tuesday, January 1, 2019 | 57714000000 | 59241145000 |
| Wednesday, January 1, 2020 | 55179000000 | 73667133000 |
| Friday, January 1, 2021 | 57351000000 | 87606026000 |
| Saturday, January 1, 2022 | 60530000000 | 96495809000 |
| Sunday, January 1, 2023 | 61860000000 | 103468159000 |
| Monday, January 1, 2024 | 62753000000 |
Unveiling the hidden dimensions of data
In the ever-evolving landscape of global technology, the revenue trajectories of International Business Machines Corporation (IBM) and NetEase, Inc. offer a fascinating study. From 2014 to 2023, IBM's revenue has seen a gradual decline, starting at approximately $92.8 billion in 2014 and dropping to around $62.8 billion by 2023. This represents a decrease of about 32%, reflecting the challenges faced by traditional tech giants in adapting to new market demands.
Conversely, NetEase, a leading Chinese internet technology company, has experienced a remarkable revenue surge. From a modest $11.7 billion in 2014, its revenue skyrocketed to an impressive $103.5 billion by 2023, marking an extraordinary growth of nearly 785%. This stark contrast highlights the shifting dynamics in the tech industry, where agile, internet-focused companies are rapidly gaining ground.
The data for 2024 is incomplete, leaving room for speculation on future trends.
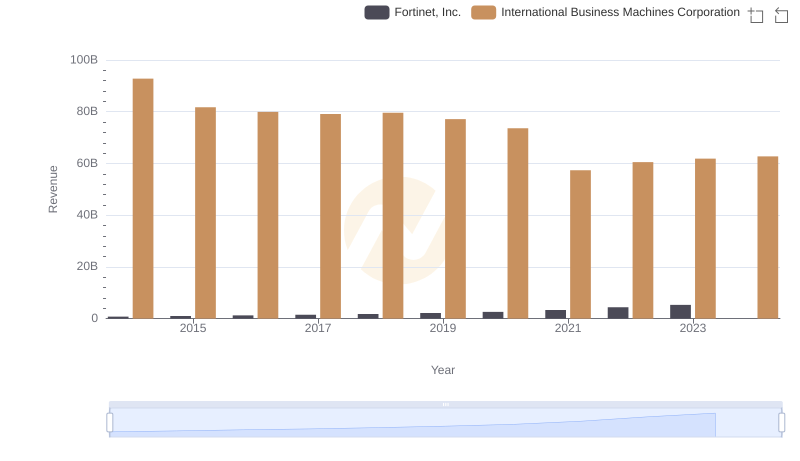
Revenue Insights: International Business Machines Corporation and Fortinet, Inc. Performance Compared
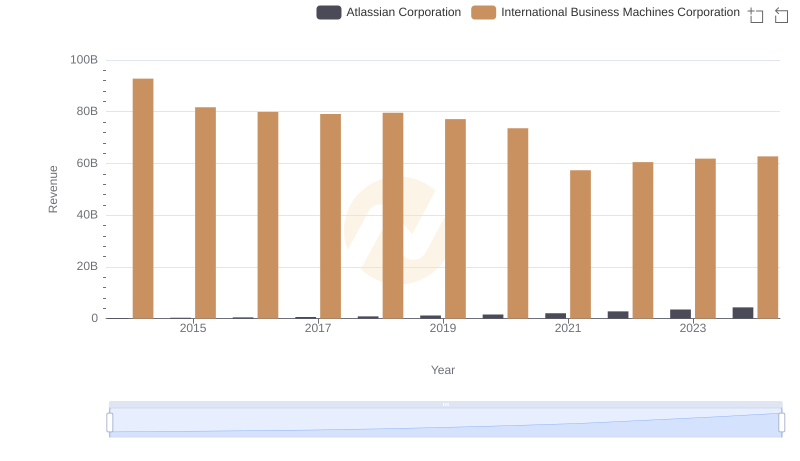
International Business Machines Corporation and Atlassian Corporation: A Comprehensive Revenue Analysis
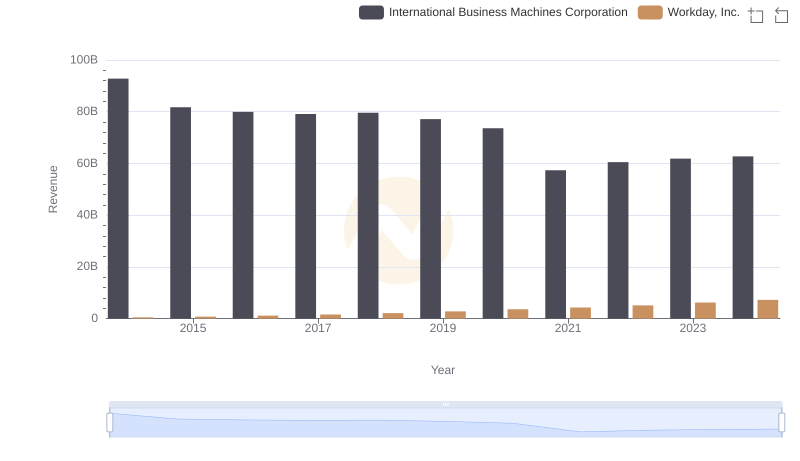
Revenue Insights: International Business Machines Corporation and Workday, Inc. Performance Compared
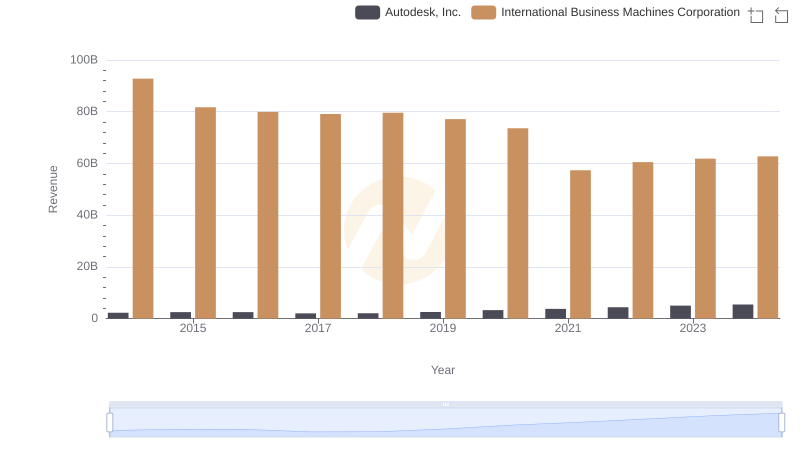
Breaking Down Revenue Trends: International Business Machines Corporation vs Autodesk, Inc.
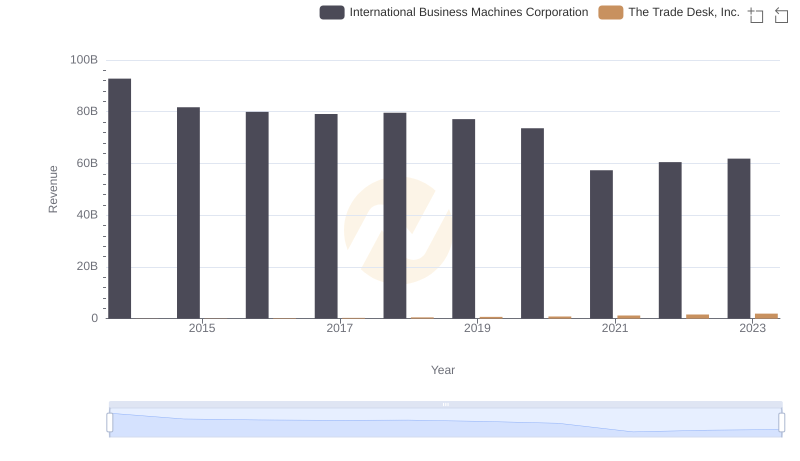
International Business Machines Corporation and The Trade Desk, Inc.: A Comprehensive Revenue Analysis
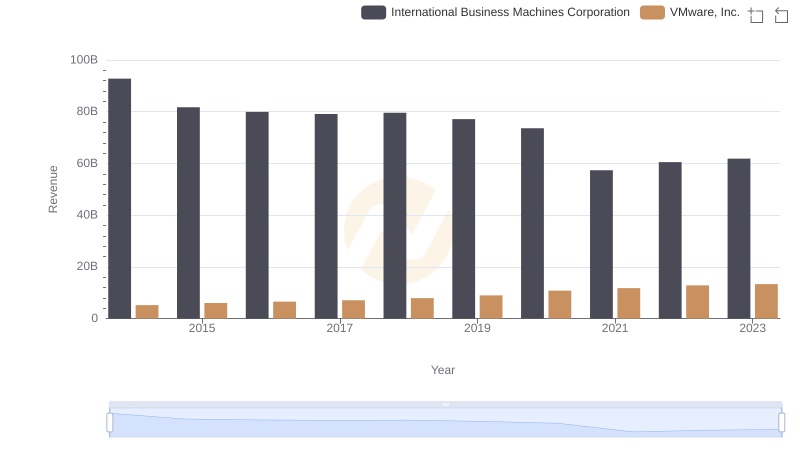
Revenue Insights: International Business Machines Corporation and VMware, Inc. Performance Compared
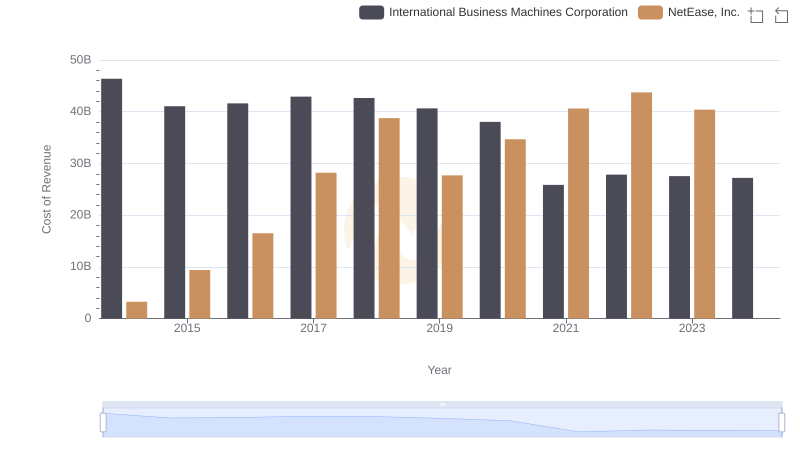
Cost of Revenue: Key Insights for International Business Machines Corporation and NetEase, Inc.
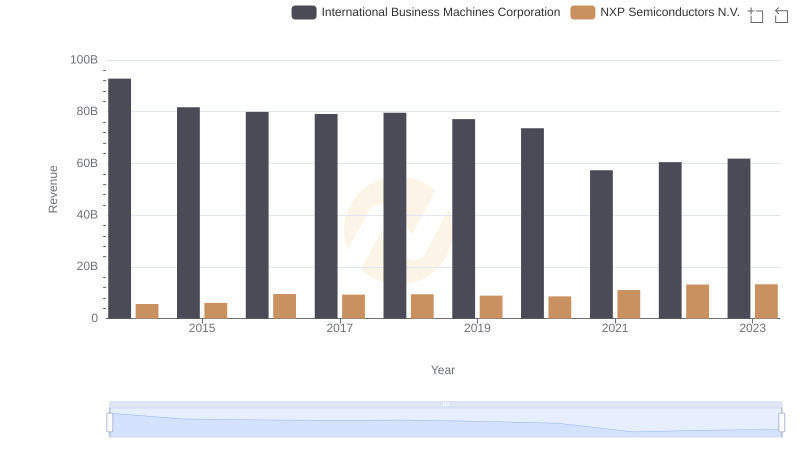
Comparing Revenue Performance: International Business Machines Corporation or NXP Semiconductors N.V.?
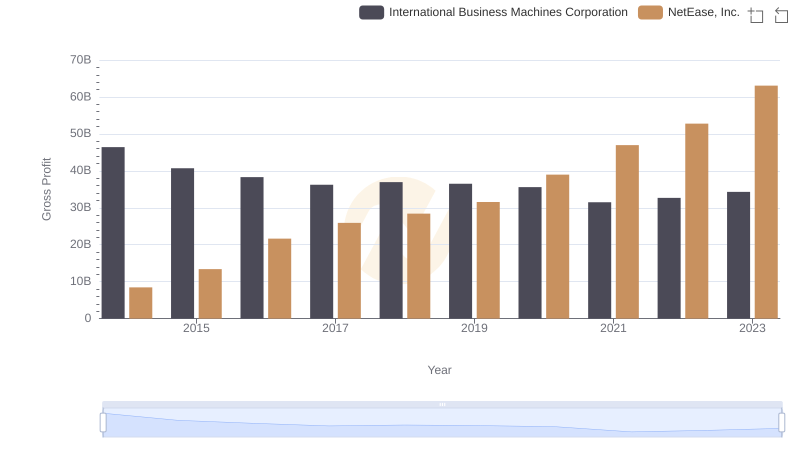
Gross Profit Analysis: Comparing International Business Machines Corporation and NetEase, Inc.
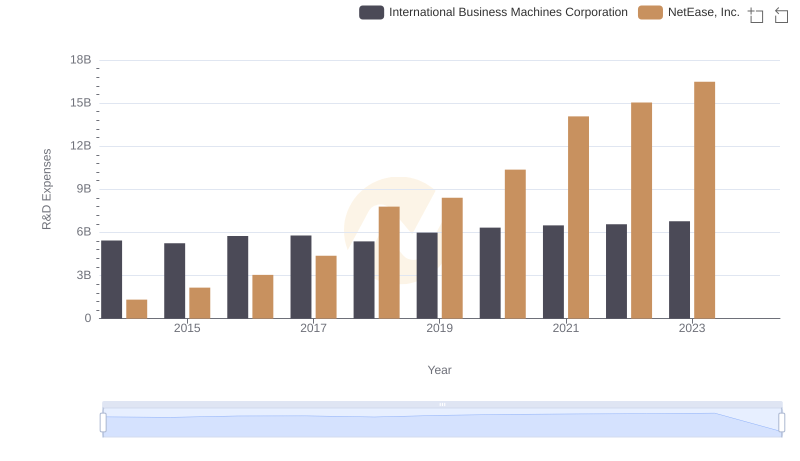
Who Prioritizes Innovation? R&D Spending Compared for International Business Machines Corporation and NetEase, Inc.
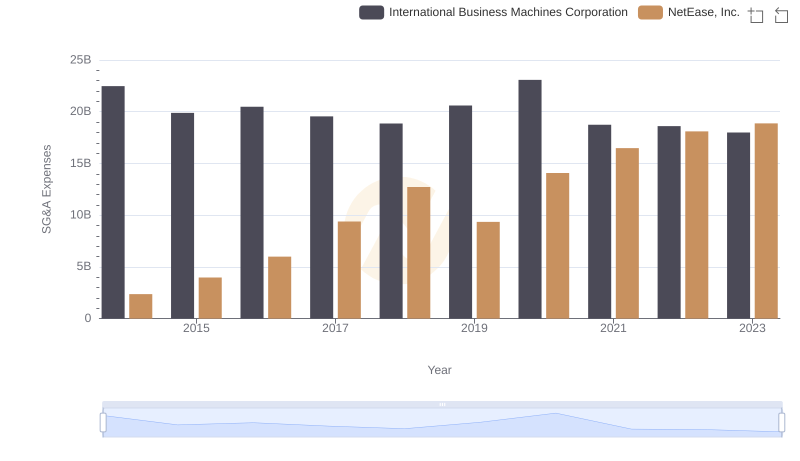
Cost Management Insights: SG&A Expenses for International Business Machines Corporation and NetEase, Inc.
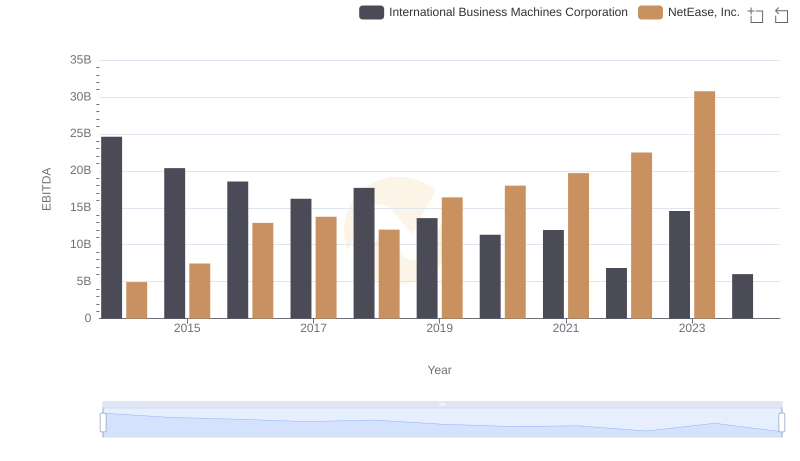
A Professional Review of EBITDA: International Business Machines Corporation Compared to NetEase, Inc.