| __timestamp | AMETEK, Inc. | Lennox International Inc. |
|---|---|---|
| Wednesday, January 1, 2014 | 4021964000 | 3367400000 |
| Thursday, January 1, 2015 | 3974295000 | 3467400000 |
| Friday, January 1, 2016 | 3840087000 | 3641600000 |
| Sunday, January 1, 2017 | 4300170000 | 3839600000 |
| Monday, January 1, 2018 | 4845872000 | 3883900000 |
| Tuesday, January 1, 2019 | 5158557000 | 3807200000 |
| Wednesday, January 1, 2020 | 4540029000 | 3634100000 |
| Friday, January 1, 2021 | 5546514000 | 4194100000 |
| Saturday, January 1, 2022 | 6150530000 | 4718400000 |
| Sunday, January 1, 2023 | 6596950000 | 4981900000 |
| Monday, January 1, 2024 | 6941180000 | 5341300000 |
Igniting the spark of knowledge
In the ever-evolving landscape of industrial manufacturing, AMETEK, Inc. and Lennox International Inc. have emerged as formidable players. Over the past decade, AMETEK has demonstrated a robust revenue growth trajectory, with a remarkable 64% increase from 2014 to 2023. In contrast, Lennox International has shown a steady rise, achieving a 48% growth in the same period. Notably, AMETEK's revenue surged past Lennox's in 2017, maintaining its lead ever since. The year 2023 marked a significant milestone for both companies, with AMETEK reaching its highest revenue point, while Lennox continued its upward trend. However, data for AMETEK in 2024 remains elusive, leaving room for speculation. This comparison not only highlights the resilience and adaptability of these companies but also underscores the dynamic nature of the industrial sector.
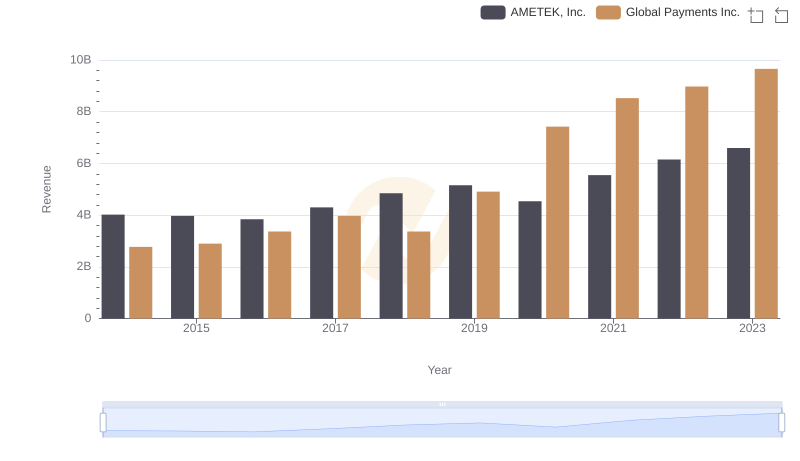
AMETEK, Inc. or Global Payments Inc.: Who Leads in Yearly Revenue?
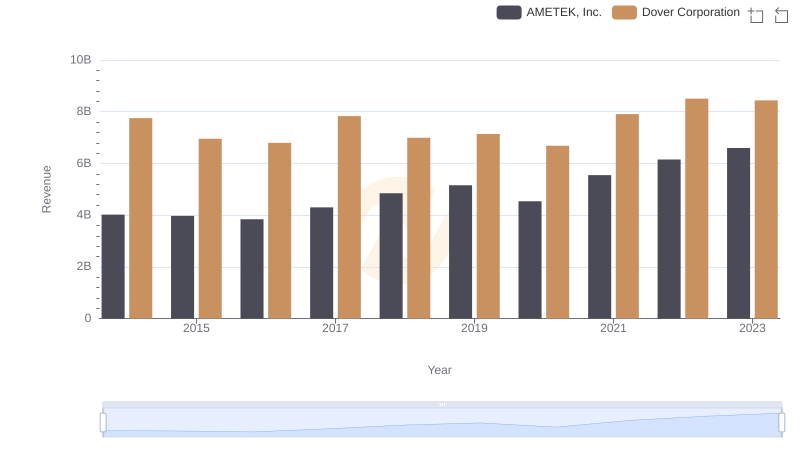
AMETEK, Inc. vs Dover Corporation: Examining Key Revenue Metrics
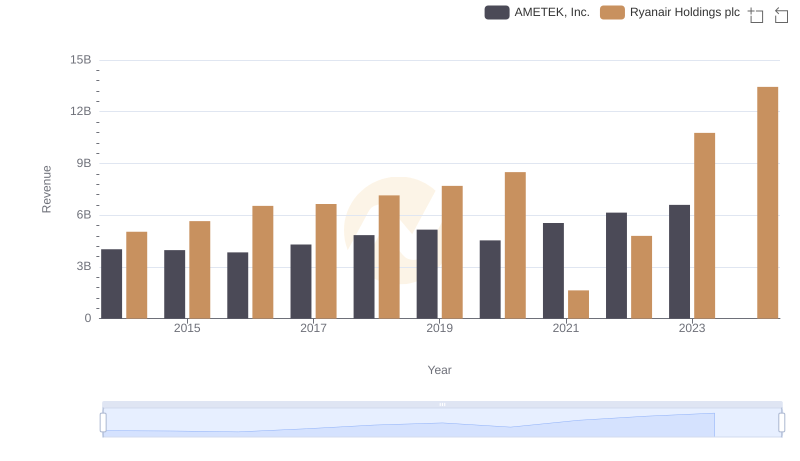
AMETEK, Inc. vs Ryanair Holdings plc: Examining Key Revenue Metrics
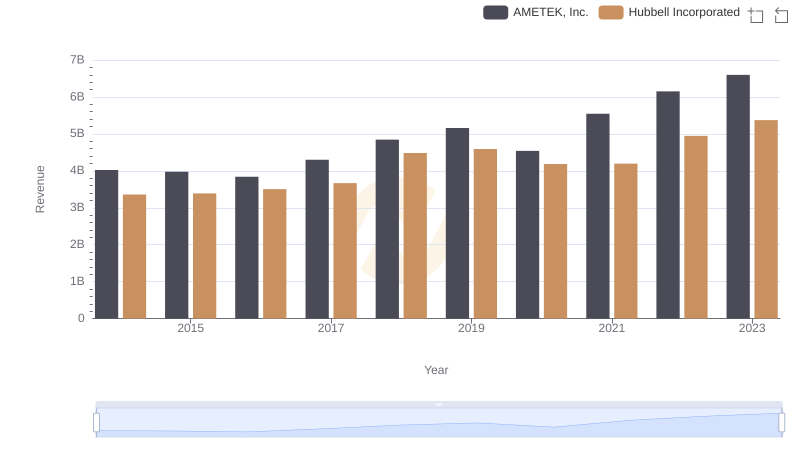
Breaking Down Revenue Trends: AMETEK, Inc. vs Hubbell Incorporated
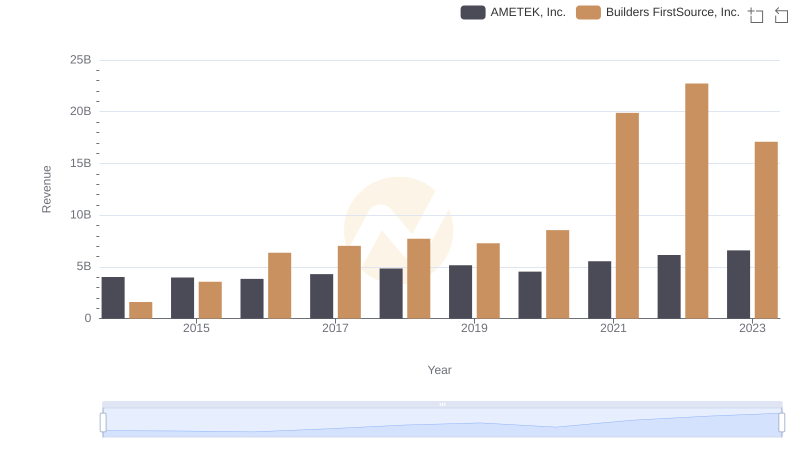
Breaking Down Revenue Trends: AMETEK, Inc. vs Builders FirstSource, Inc.
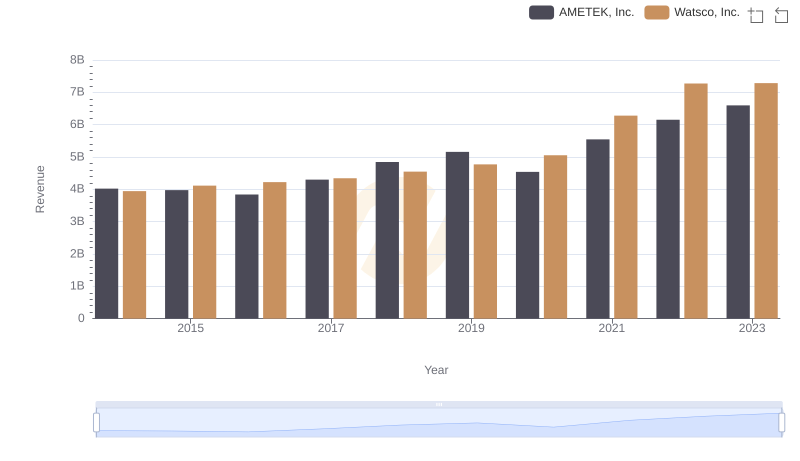
Comparing Revenue Performance: AMETEK, Inc. or Watsco, Inc.?
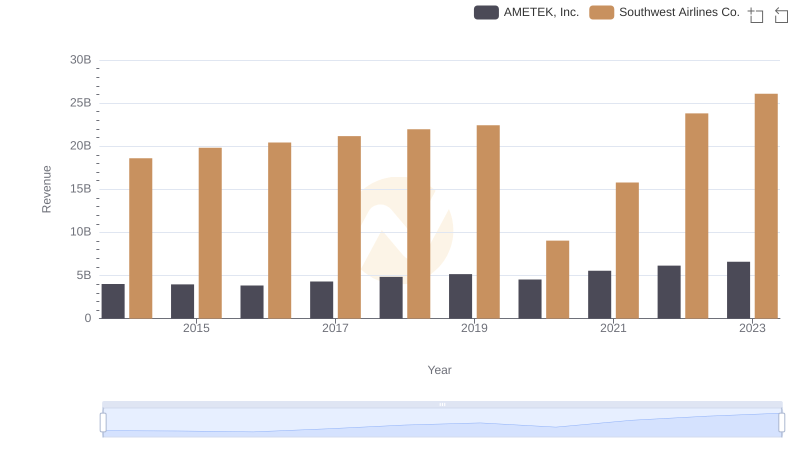
Who Generates More Revenue? AMETEK, Inc. or Southwest Airlines Co.
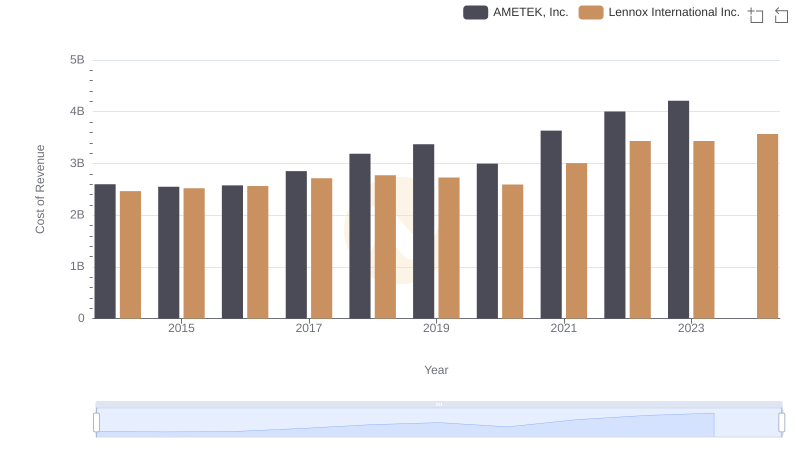
Cost of Revenue Comparison: AMETEK, Inc. vs Lennox International Inc.
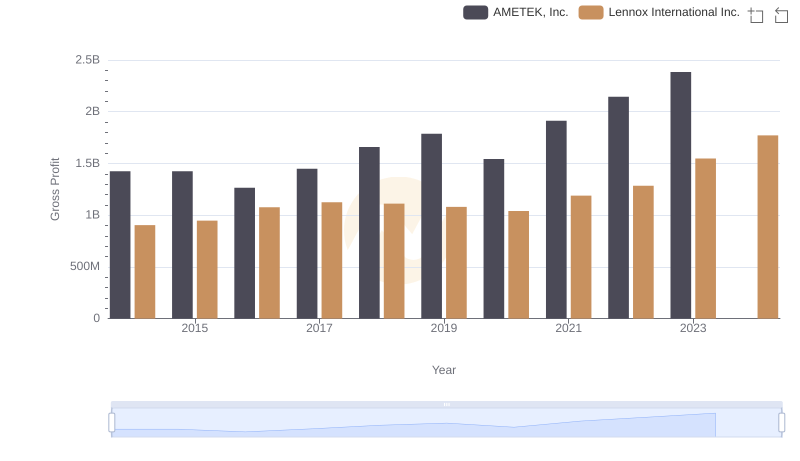
Gross Profit Analysis: Comparing AMETEK, Inc. and Lennox International Inc.
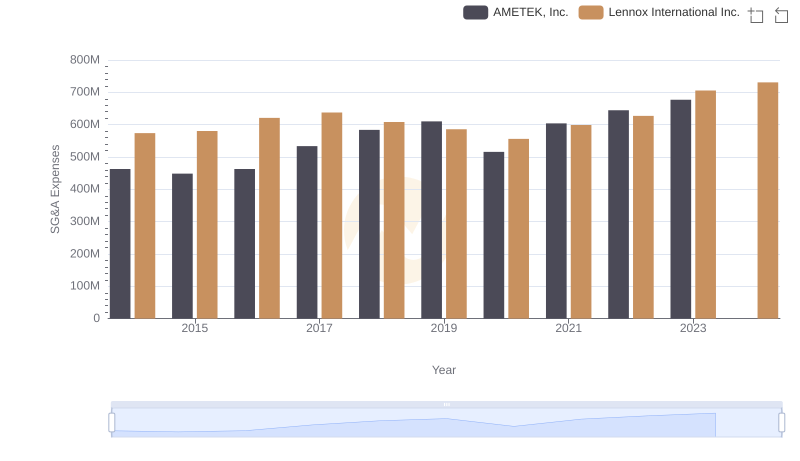
AMETEK, Inc. or Lennox International Inc.: Who Manages SG&A Costs Better?
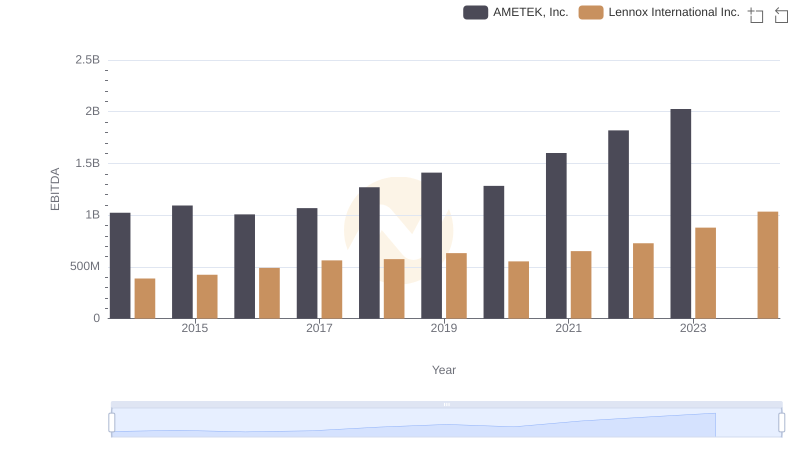
AMETEK, Inc. vs Lennox International Inc.: In-Depth EBITDA Performance Comparison