| __timestamp | AMETEK, Inc. | TransUnion |
|---|---|---|
| Wednesday, January 1, 2014 | 4021964000 | 1304700000 |
| Thursday, January 1, 2015 | 3974295000 | 1506800000 |
| Friday, January 1, 2016 | 3840087000 | 1704900000 |
| Sunday, January 1, 2017 | 4300170000 | 1933800000 |
| Monday, January 1, 2018 | 4845872000 | 2317200000 |
| Tuesday, January 1, 2019 | 5158557000 | 2656100000 |
| Wednesday, January 1, 2020 | 4540029000 | 2716600000 |
| Friday, January 1, 2021 | 5546514000 | 2960200000 |
| Saturday, January 1, 2022 | 6150530000 | 3709900000 |
| Sunday, January 1, 2023 | 6596950000 | 3831200000 |
| Monday, January 1, 2024 | 6941180000 | 4183800000 |
In pursuit of knowledge
In the ever-evolving landscape of the American stock market, AMETEK, Inc. and TransUnion have emerged as key players, showcasing impressive revenue growth over the past decade. From 2014 to 2023, AMETEK, Inc. has seen its revenue soar by approximately 64%, starting from $4 billion and reaching nearly $6.6 billion. This growth trajectory highlights AMETEK's strategic positioning and adaptability in a competitive market.
Meanwhile, TransUnion has also demonstrated robust growth, with its revenue increasing by nearly 194% over the same period. Beginning at $1.3 billion in 2014, TransUnion's revenue climbed to approximately $3.8 billion by 2023. This remarkable growth underscores TransUnion's expanding influence in the financial services sector.
Both companies have navigated economic fluctuations and market challenges, reflecting their resilience and commitment to innovation. As we look to the future, these trends offer valuable insights into the potential trajectories of these industry giants.
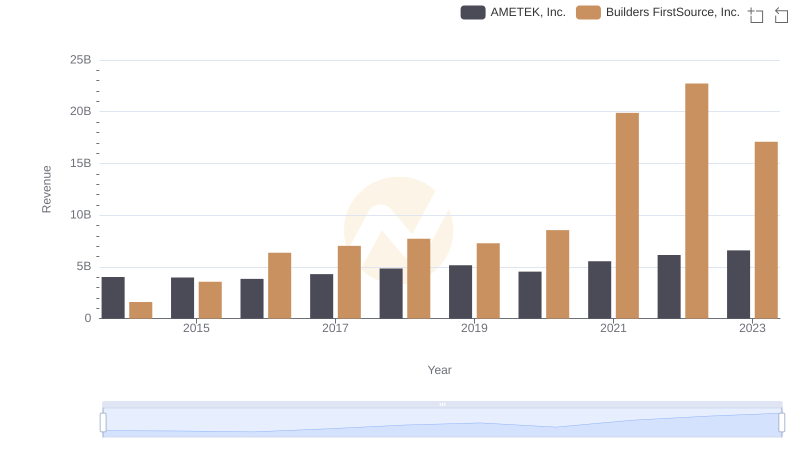
Breaking Down Revenue Trends: AMETEK, Inc. vs Builders FirstSource, Inc.
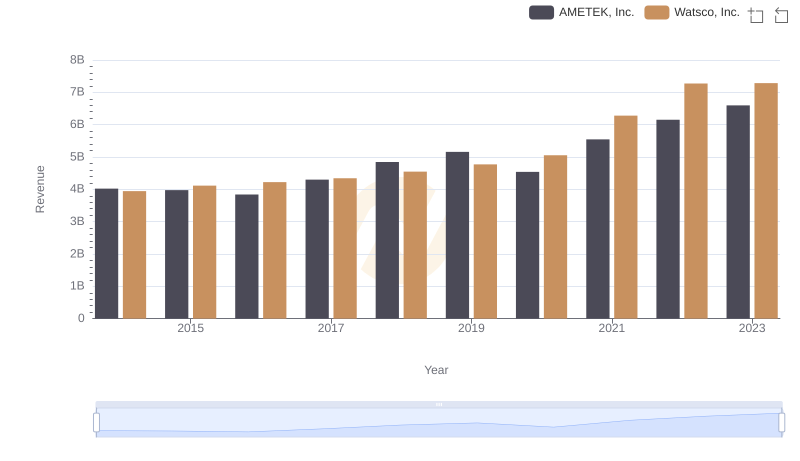
Comparing Revenue Performance: AMETEK, Inc. or Watsco, Inc.?
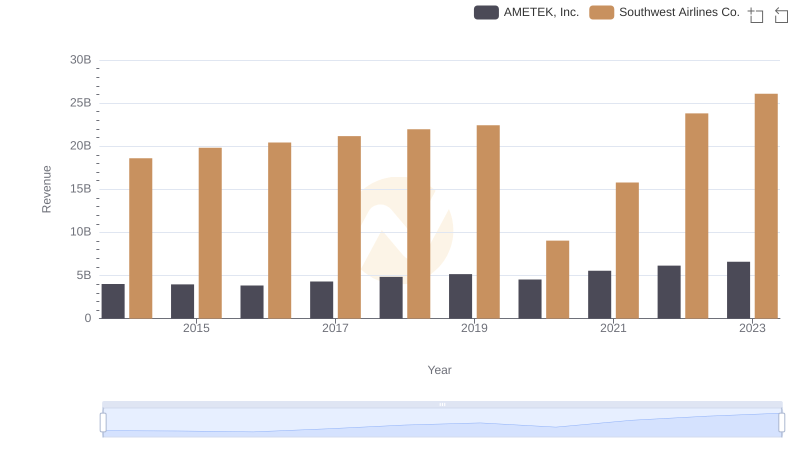
Who Generates More Revenue? AMETEK, Inc. or Southwest Airlines Co.
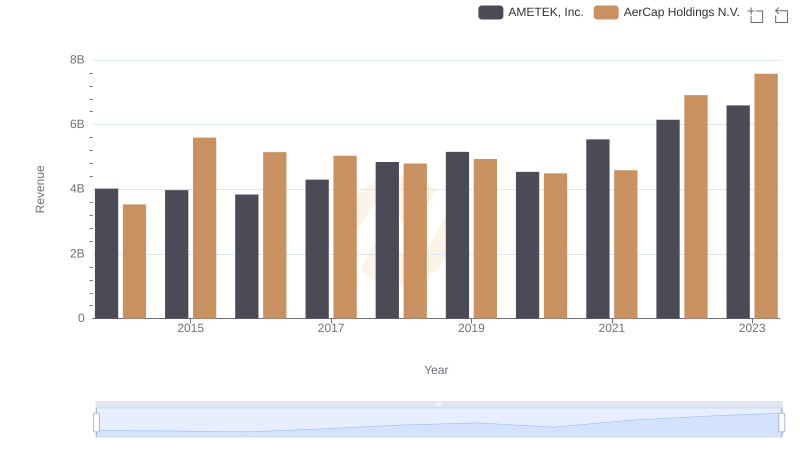
Annual Revenue Comparison: AMETEK, Inc. vs AerCap Holdings N.V.
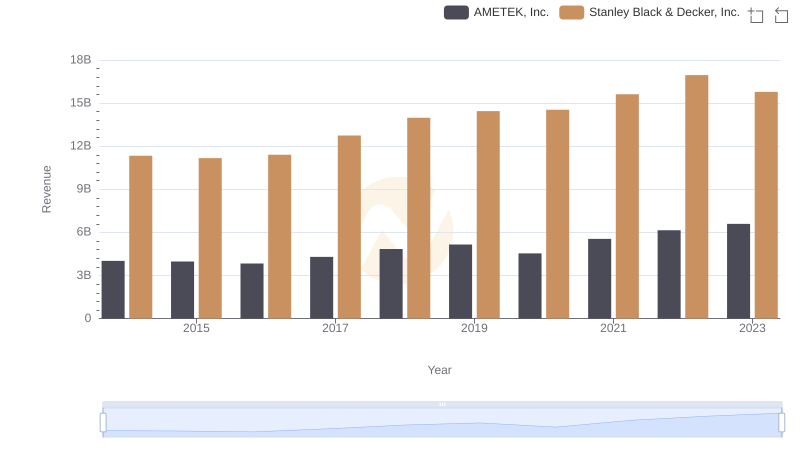
AMETEK, Inc. vs Stanley Black & Decker, Inc.: Annual Revenue Growth Compared
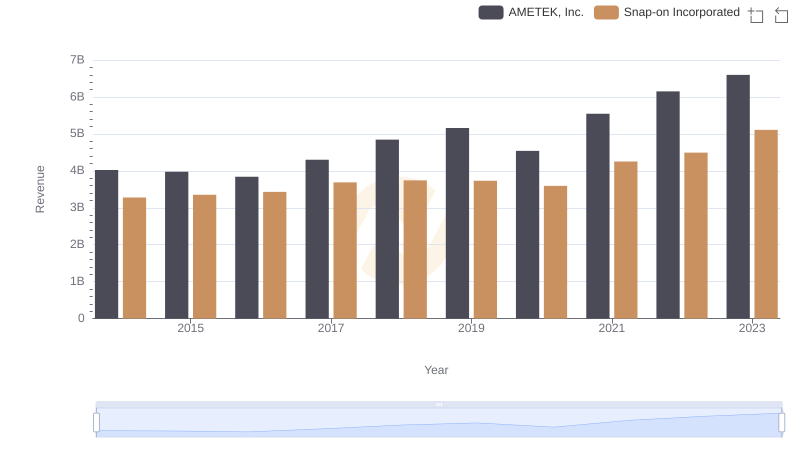
Annual Revenue Comparison: AMETEK, Inc. vs Snap-on Incorporated
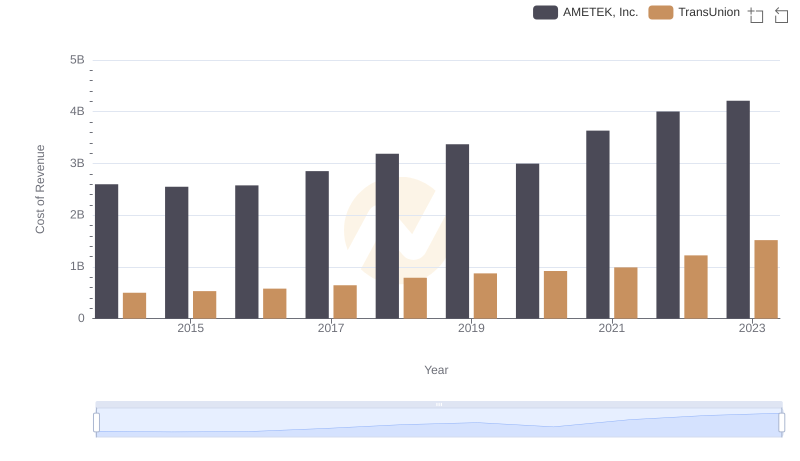
Cost of Revenue: Key Insights for AMETEK, Inc. and TransUnion

AMETEK, Inc. or TransUnion: Who Manages SG&A Costs Better?
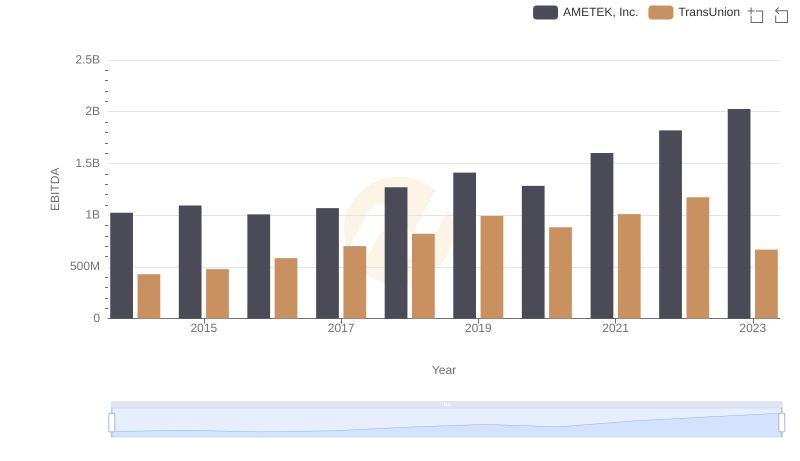
A Professional Review of EBITDA: AMETEK, Inc. Compared to TransUnion