| __timestamp | AMETEK, Inc. | Stanley Black & Decker, Inc. |
|---|---|---|
| Wednesday, January 1, 2014 | 4021964000 | 11338600000 |
| Thursday, January 1, 2015 | 3974295000 | 11171800000 |
| Friday, January 1, 2016 | 3840087000 | 11406900000 |
| Sunday, January 1, 2017 | 4300170000 | 12747200000 |
| Monday, January 1, 2018 | 4845872000 | 13982400000 |
| Tuesday, January 1, 2019 | 5158557000 | 14442200000 |
| Wednesday, January 1, 2020 | 4540029000 | 14534600000 |
| Friday, January 1, 2021 | 5546514000 | 15617200000 |
| Saturday, January 1, 2022 | 6150530000 | 16947400000 |
| Sunday, January 1, 2023 | 6596950000 | 15781100000 |
| Monday, January 1, 2024 | 6941180000 | 15365700000 |
Unleashing the power of data
In the ever-evolving landscape of industrial manufacturing, AMETEK, Inc. and Stanley Black & Decker, Inc. have emerged as formidable players. Over the past decade, these companies have demonstrated resilience and adaptability, navigating economic fluctuations with strategic prowess.
From 2014 to 2023, AMETEK, Inc. showcased a remarkable revenue growth of approximately 64%, climbing from $4 billion to nearly $6.6 billion. This growth trajectory underscores AMETEK's commitment to innovation and market expansion. Meanwhile, Stanley Black & Decker, Inc. experienced a more modest growth of around 39%, with revenues increasing from $11.3 billion to $15.8 billion.
Despite facing challenges in 2020, both companies rebounded strongly, with AMETEK achieving a 36% increase in revenue by 2023. This comparison highlights the dynamic nature of the industrial sector and the strategic maneuvers that define success in this competitive arena.
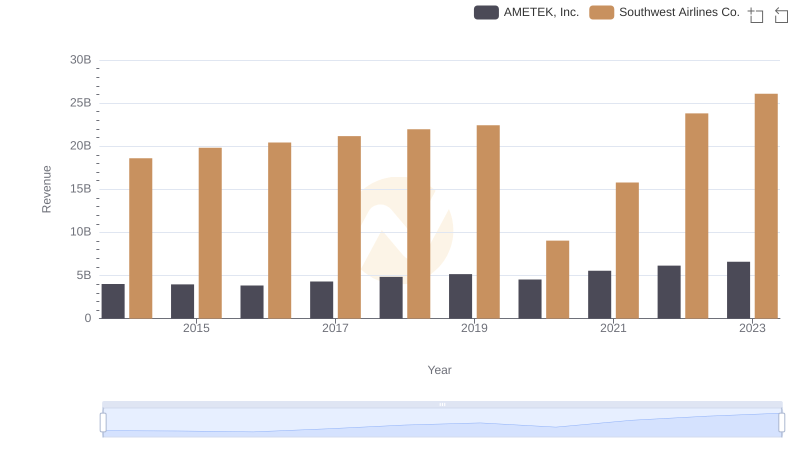
Who Generates More Revenue? AMETEK, Inc. or Southwest Airlines Co.
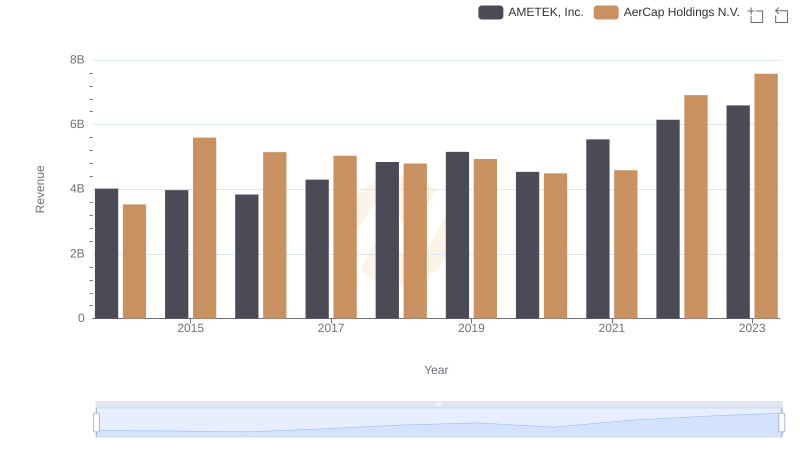
Annual Revenue Comparison: AMETEK, Inc. vs AerCap Holdings N.V.
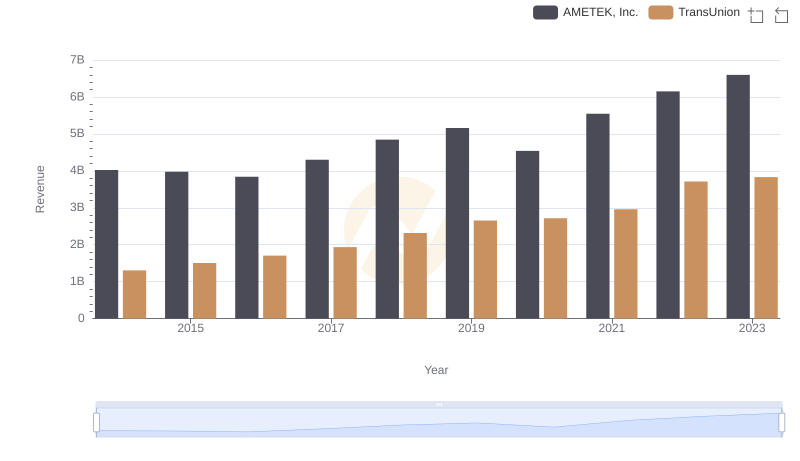
AMETEK, Inc. vs TransUnion: Examining Key Revenue Metrics
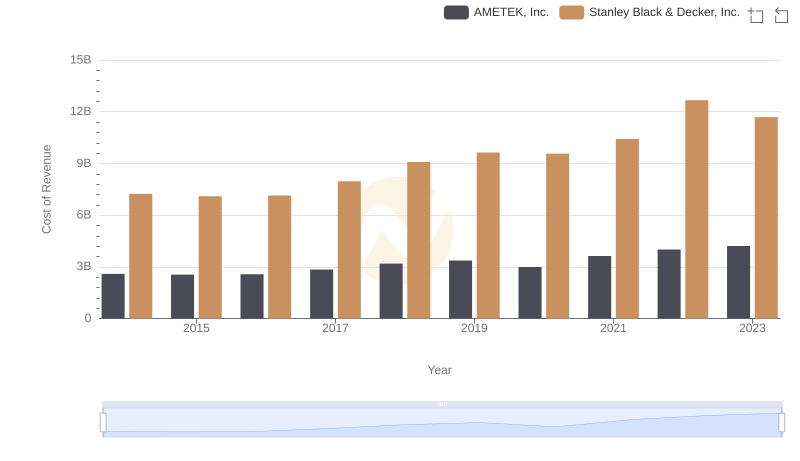
Comparing Cost of Revenue Efficiency: AMETEK, Inc. vs Stanley Black & Decker, Inc.

AMETEK, Inc. and Stanley Black & Decker, Inc.: SG&A Spending Patterns Compared

Comparative EBITDA Analysis: AMETEK, Inc. vs Stanley Black & Decker, Inc.
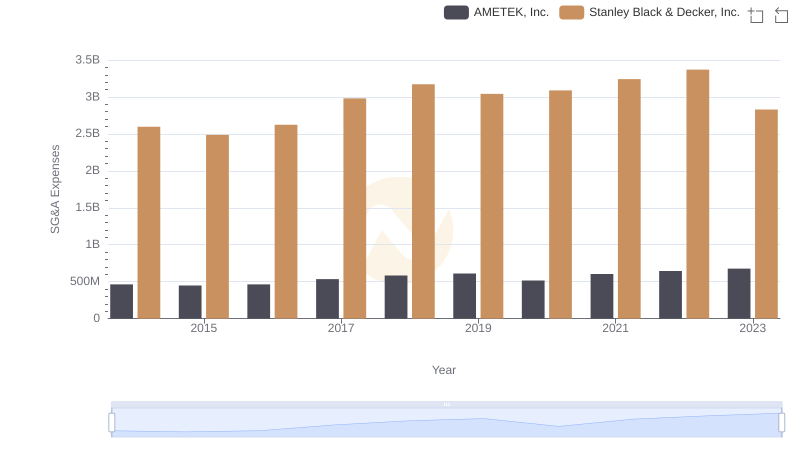
AMETEK, Inc. and Stanley Black & Decker, Inc.: SG&A Spending Patterns Compared
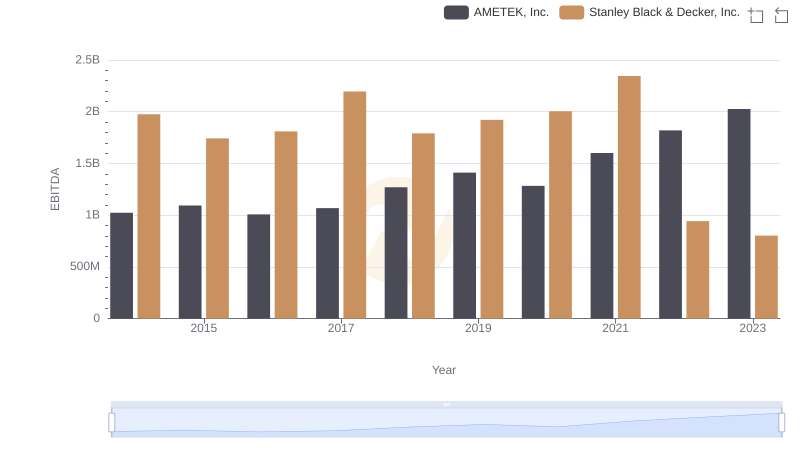
Professional EBITDA Benchmarking: AMETEK, Inc. vs Stanley Black & Decker, Inc.