| __timestamp | AMETEK, Inc. | Builders FirstSource, Inc. |
|---|---|---|
| Wednesday, January 1, 2014 | 4021964000 | 1604096000 |
| Thursday, January 1, 2015 | 3974295000 | 3564425000 |
| Friday, January 1, 2016 | 3840087000 | 6367284000 |
| Sunday, January 1, 2017 | 4300170000 | 7034209000 |
| Monday, January 1, 2018 | 4845872000 | 7724771000 |
| Tuesday, January 1, 2019 | 5158557000 | 7280431000 |
| Wednesday, January 1, 2020 | 4540029000 | 8558874000 |
| Friday, January 1, 2021 | 5546514000 | 19893856000 |
| Saturday, January 1, 2022 | 6150530000 | 22726418000 |
| Sunday, January 1, 2023 | 6596950000 | 17097330000 |
| Monday, January 1, 2024 | 6941180000 |
Unlocking the unknown
In the ever-evolving landscape of the industrial sector, AMETEK, Inc. and Builders FirstSource, Inc. have showcased intriguing revenue trajectories over the past decade. From 2014 to 2023, AMETEK, Inc. experienced a steady revenue growth of approximately 64%, starting from $4 billion and reaching nearly $6.6 billion. This growth reflects AMETEK's strategic expansion and innovation in electronic instruments and electromechanical devices.
Conversely, Builders FirstSource, Inc. demonstrated a remarkable revenue surge of over 960% during the same period, skyrocketing from $1.6 billion to a peak of $22.7 billion in 2022, before slightly declining to $17.1 billion in 2023. This dramatic increase underscores the company's robust position in the building materials industry, driven by a booming housing market and strategic acquisitions.
These trends highlight the dynamic nature of these industries and the companies' ability to adapt and thrive in changing economic climates.
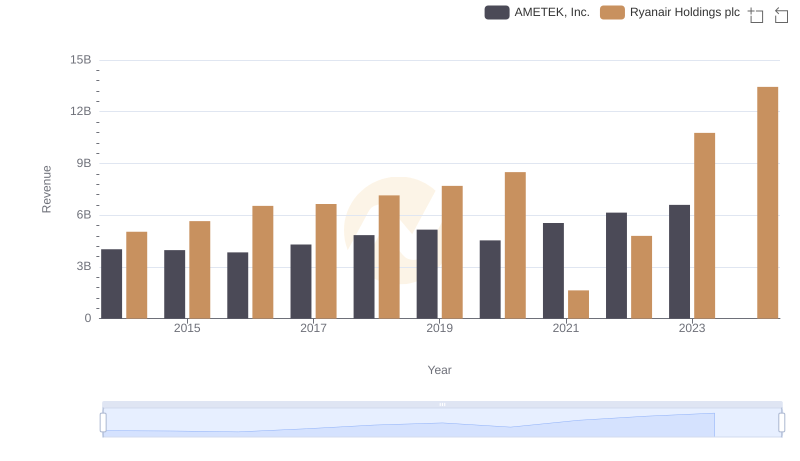
AMETEK, Inc. vs Ryanair Holdings plc: Examining Key Revenue Metrics
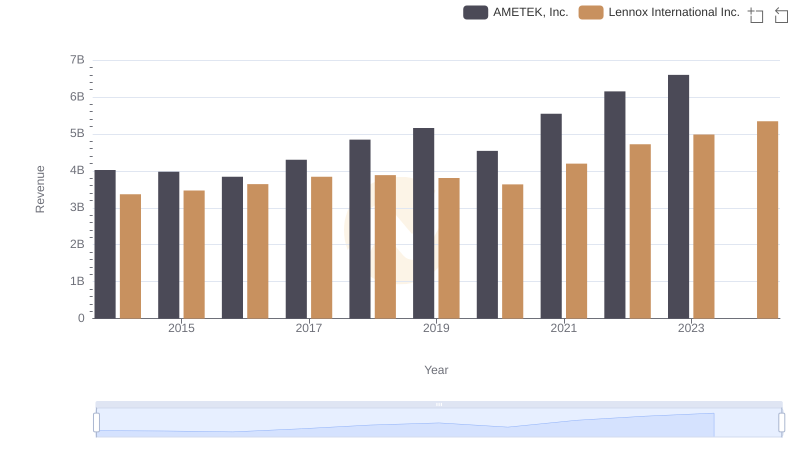
Annual Revenue Comparison: AMETEK, Inc. vs Lennox International Inc.
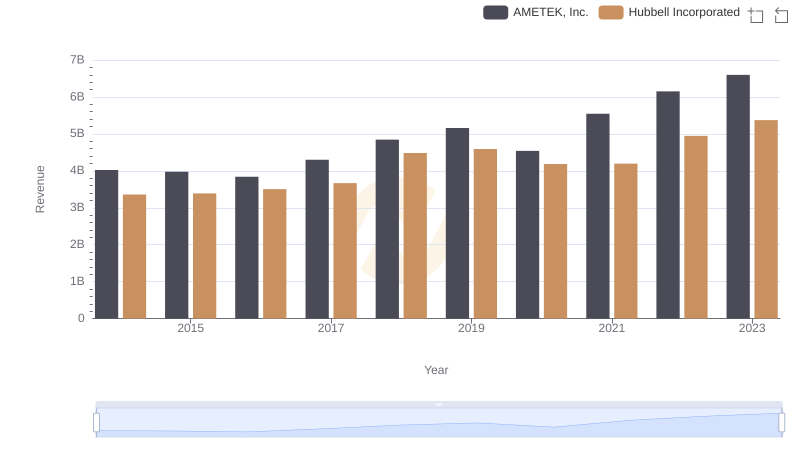
Breaking Down Revenue Trends: AMETEK, Inc. vs Hubbell Incorporated
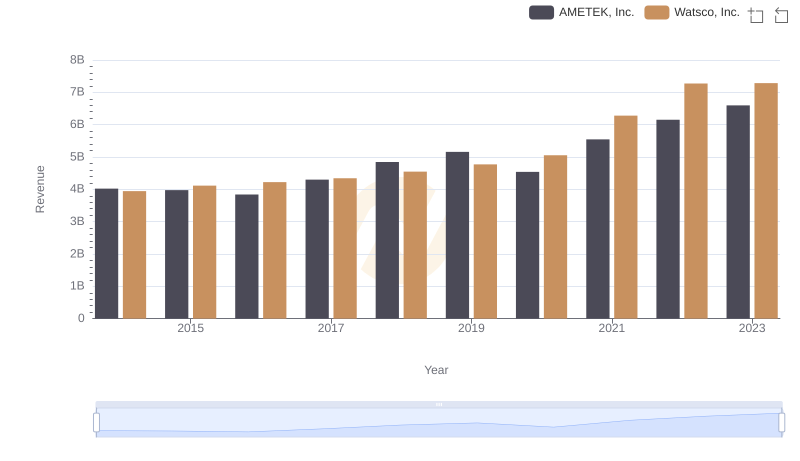
Comparing Revenue Performance: AMETEK, Inc. or Watsco, Inc.?
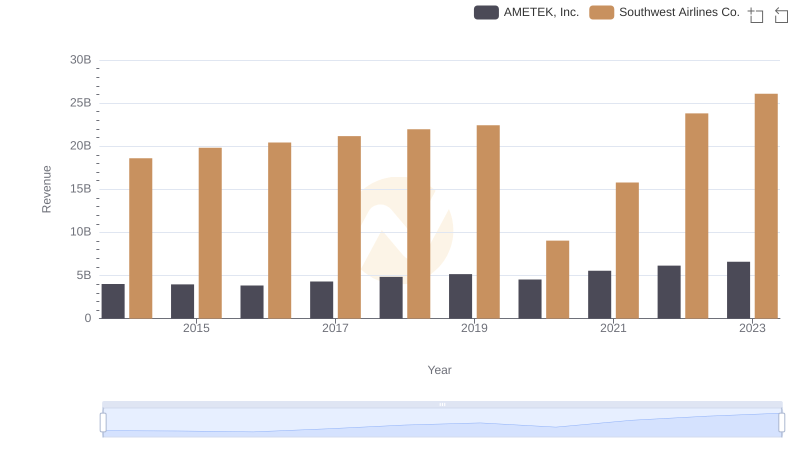
Who Generates More Revenue? AMETEK, Inc. or Southwest Airlines Co.
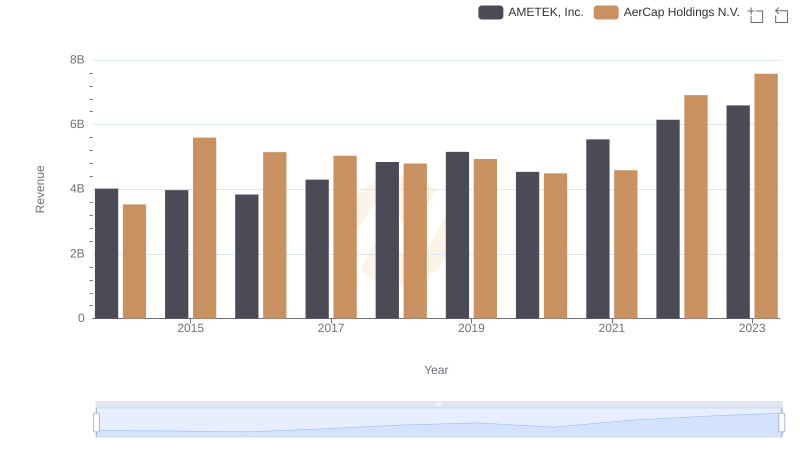
Annual Revenue Comparison: AMETEK, Inc. vs AerCap Holdings N.V.
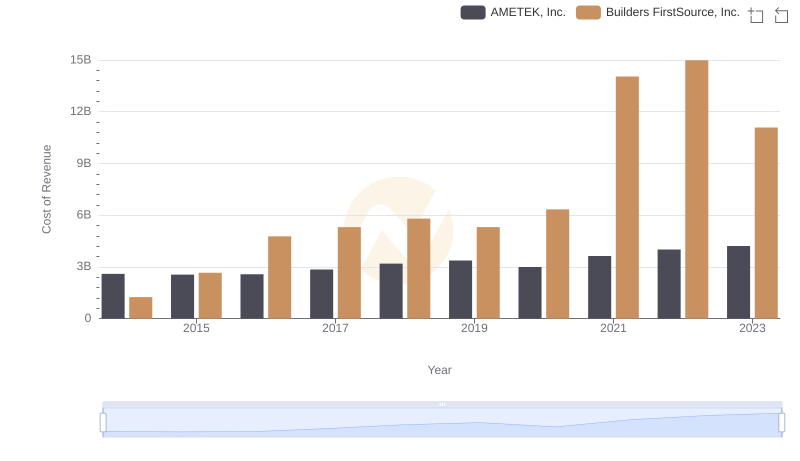
Cost of Revenue Comparison: AMETEK, Inc. vs Builders FirstSource, Inc.
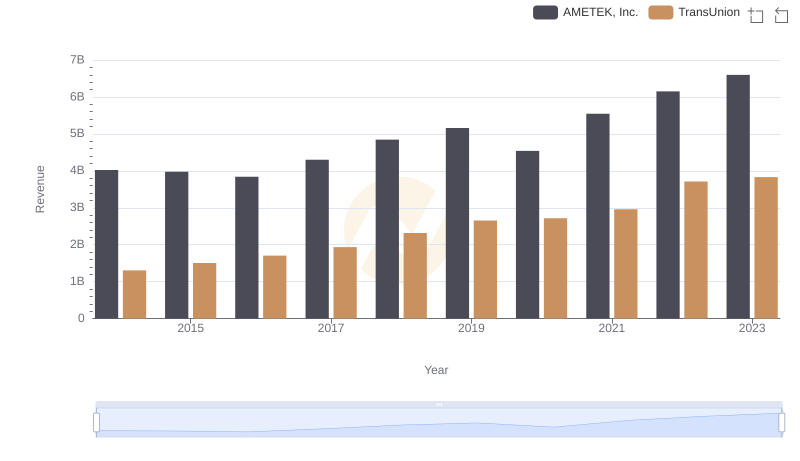
AMETEK, Inc. vs TransUnion: Examining Key Revenue Metrics
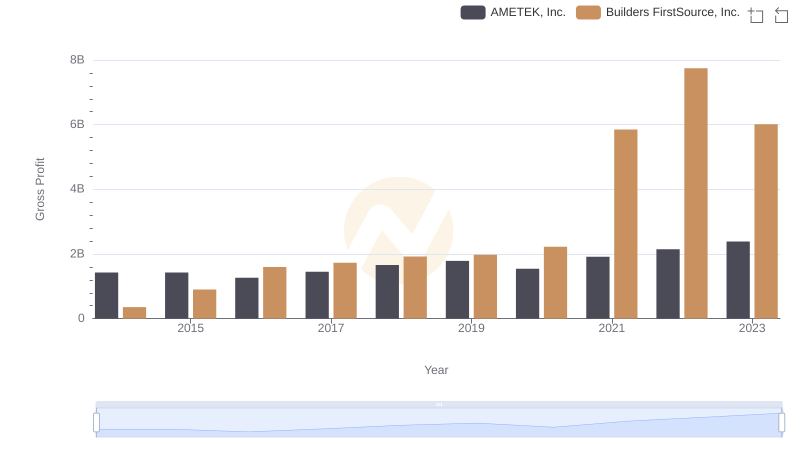
Gross Profit Trends Compared: AMETEK, Inc. vs Builders FirstSource, Inc.
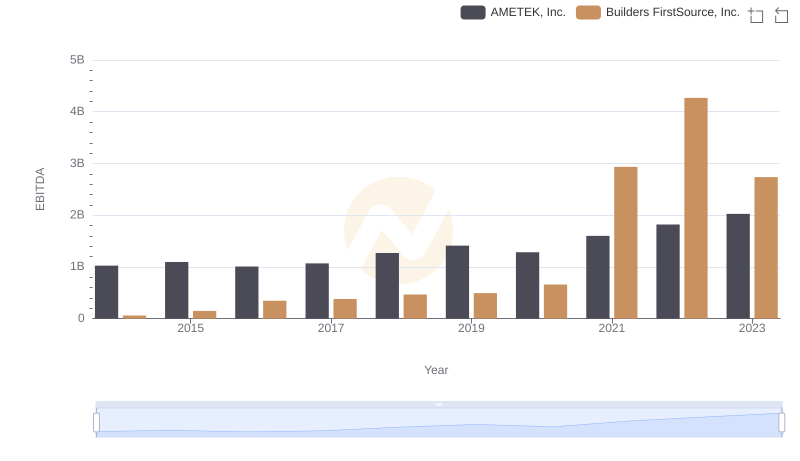
EBITDA Metrics Evaluated: AMETEK, Inc. vs Builders FirstSource, Inc.