| __timestamp | AMETEK, Inc. | Hubbell Incorporated |
|---|---|---|
| Wednesday, January 1, 2014 | 4021964000 | 3359400000 |
| Thursday, January 1, 2015 | 3974295000 | 3390400000 |
| Friday, January 1, 2016 | 3840087000 | 3505200000 |
| Sunday, January 1, 2017 | 4300170000 | 3668800000 |
| Monday, January 1, 2018 | 4845872000 | 4481700000 |
| Tuesday, January 1, 2019 | 5158557000 | 4591000000 |
| Wednesday, January 1, 2020 | 4540029000 | 4186000000 |
| Friday, January 1, 2021 | 5546514000 | 4194100000 |
| Saturday, January 1, 2022 | 6150530000 | 4947900000 |
| Sunday, January 1, 2023 | 6596950000 | 5372900000 |
| Monday, January 1, 2024 | 6941180000 | 5628500000 |
Igniting the spark of knowledge
In the competitive landscape of industrial manufacturing, AMETEK, Inc. and Hubbell Incorporated have showcased intriguing revenue trajectories over the past decade. From 2014 to 2023, AMETEK's revenue surged by approximately 64%, reflecting its robust growth strategy and market adaptability. In contrast, Hubbell Incorporated experienced a steady increase of around 60% during the same period, underscoring its resilience and consistent market presence.
AMETEK's revenue growth was particularly notable in 2021, with a 22% increase from the previous year, signaling a strong recovery post-pandemic. Meanwhile, Hubbell's revenue saw a significant uptick in 2022, growing by 18% compared to 2021, as it capitalized on emerging market opportunities.
These trends highlight the dynamic nature of the industrial sector, where strategic innovation and market responsiveness are key to sustained success.
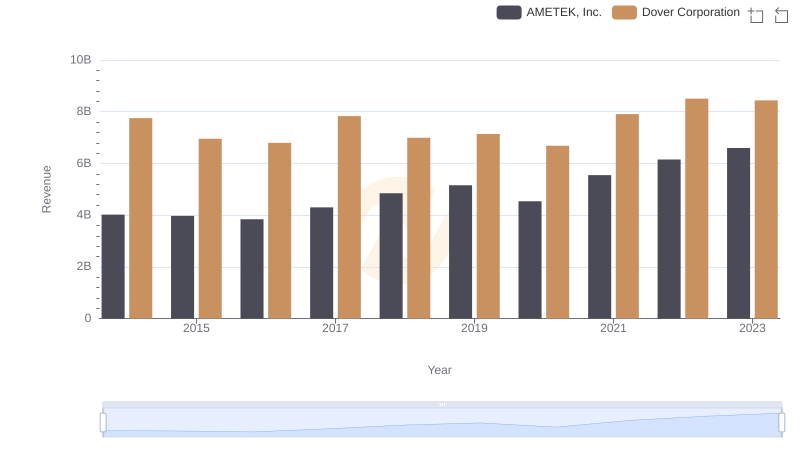
AMETEK, Inc. vs Dover Corporation: Examining Key Revenue Metrics
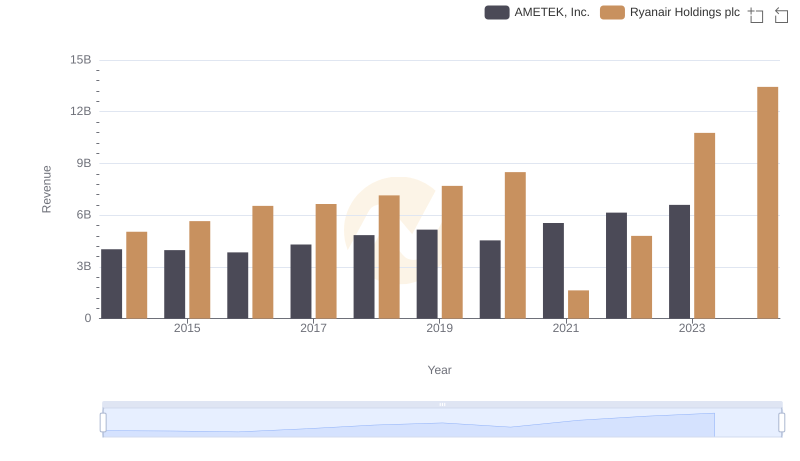
AMETEK, Inc. vs Ryanair Holdings plc: Examining Key Revenue Metrics
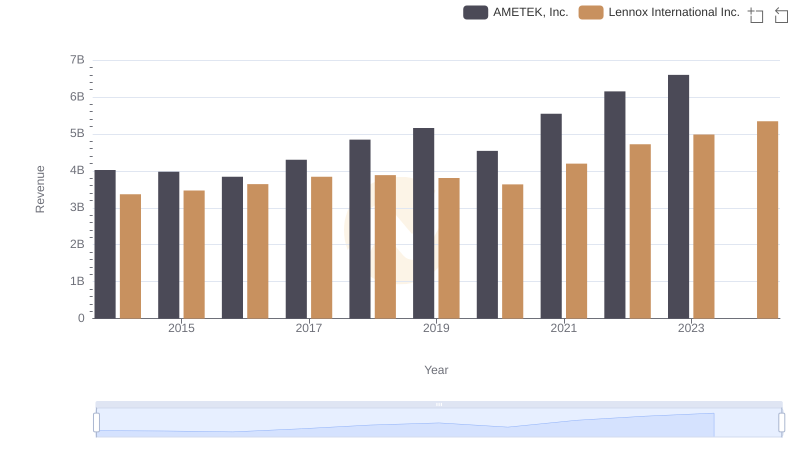
Annual Revenue Comparison: AMETEK, Inc. vs Lennox International Inc.
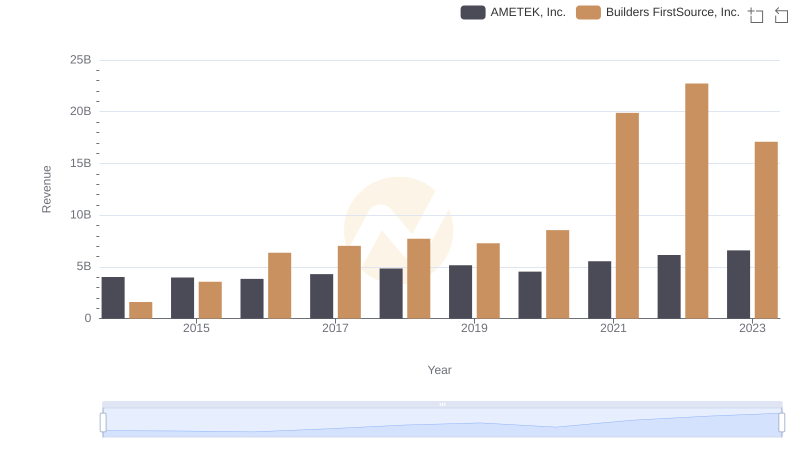
Breaking Down Revenue Trends: AMETEK, Inc. vs Builders FirstSource, Inc.
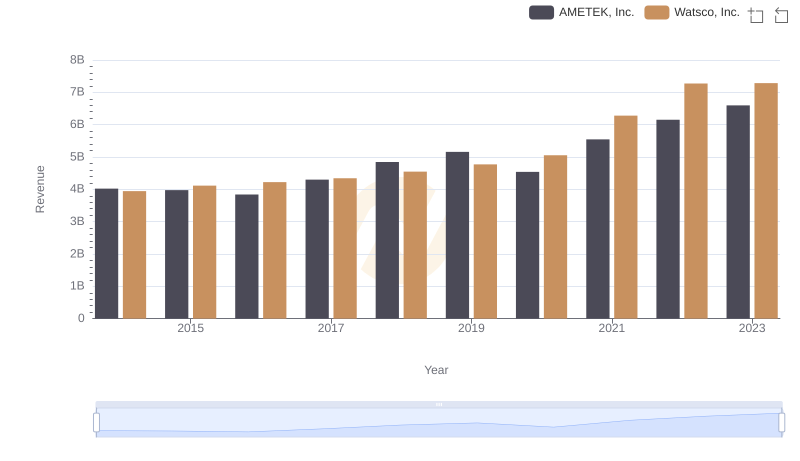
Comparing Revenue Performance: AMETEK, Inc. or Watsco, Inc.?
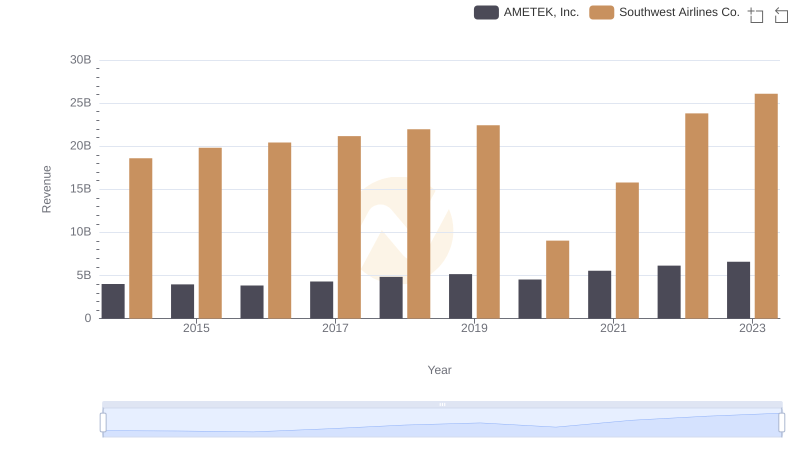
Who Generates More Revenue? AMETEK, Inc. or Southwest Airlines Co.

Cost Insights: Breaking Down AMETEK, Inc. and Hubbell Incorporated's Expenses
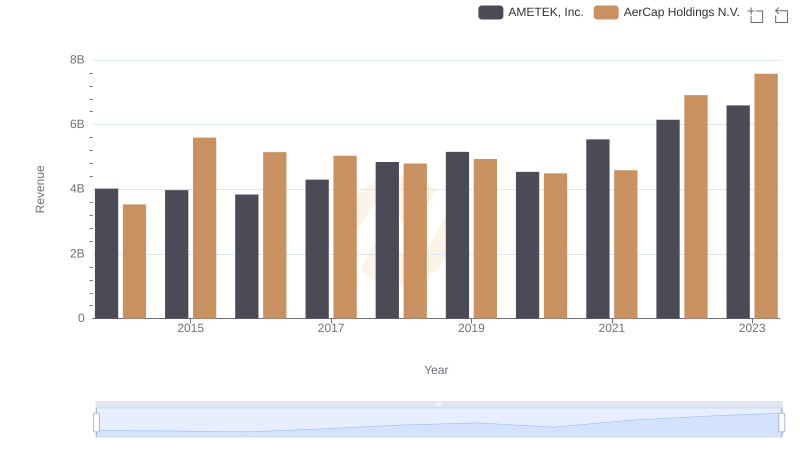
Annual Revenue Comparison: AMETEK, Inc. vs AerCap Holdings N.V.
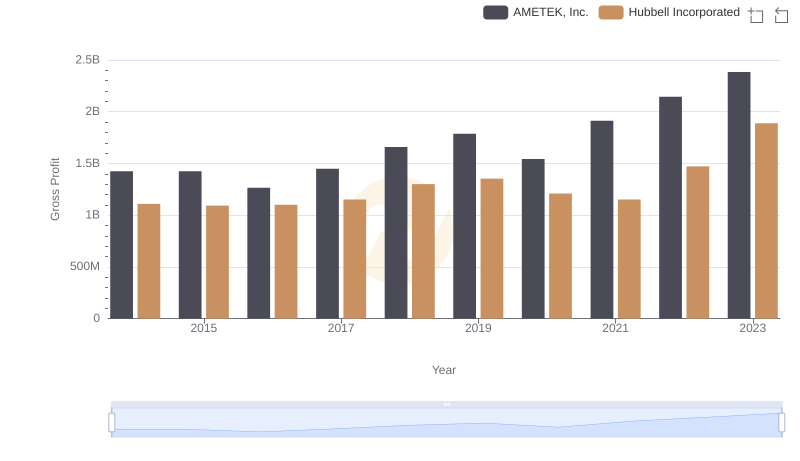
Gross Profit Analysis: Comparing AMETEK, Inc. and Hubbell Incorporated
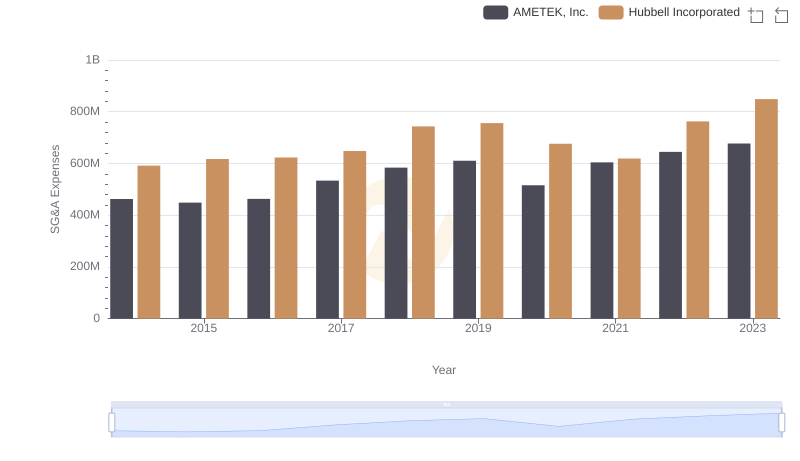
Breaking Down SG&A Expenses: AMETEK, Inc. vs Hubbell Incorporated