| __timestamp | Builders FirstSource, Inc. | Waste Connections, Inc. |
|---|---|---|
| Wednesday, January 1, 2014 | 60008000 | 717805000 |
| Thursday, January 1, 2015 | 148897000 | 191002871 |
| Friday, January 1, 2016 | 346129000 | 900371894 |
| Sunday, January 1, 2017 | 378096000 | 1380632000 |
| Monday, January 1, 2018 | 466874000 | 1442229014 |
| Tuesday, January 1, 2019 | 492344000 | 1650754605 |
| Wednesday, January 1, 2020 | 660420000 | 1597555000 |
| Friday, January 1, 2021 | 2934776000 | 1891001000 |
| Saturday, January 1, 2022 | 4267346000 | 2090554149 |
| Sunday, January 1, 2023 | 2734594000 | 2261354000 |
| Monday, January 1, 2024 | 2389779000 |
Infusing magic into the data realm
In the ever-evolving landscape of corporate performance, Waste Connections, Inc. and Builders FirstSource, Inc. have emerged as formidable players. Over the past decade, these companies have demonstrated remarkable growth in EBITDA, a key indicator of financial health.
From 2014 to 2023, Builders FirstSource, Inc. saw an impressive surge, with EBITDA skyrocketing by over 4,500%, peaking in 2022. This growth reflects the company's strategic expansions and market adaptability. Meanwhile, Waste Connections, Inc. maintained a steady upward trajectory, with a 215% increase in EBITDA over the same period, showcasing its resilience and operational efficiency.
The year 2021 marked a pivotal moment when Builders FirstSource, Inc. surpassed Waste Connections, Inc. in EBITDA, highlighting its aggressive growth strategy. As we look to the future, these trends underscore the dynamic nature of the industry and the relentless pursuit of excellence by these corporate giants.
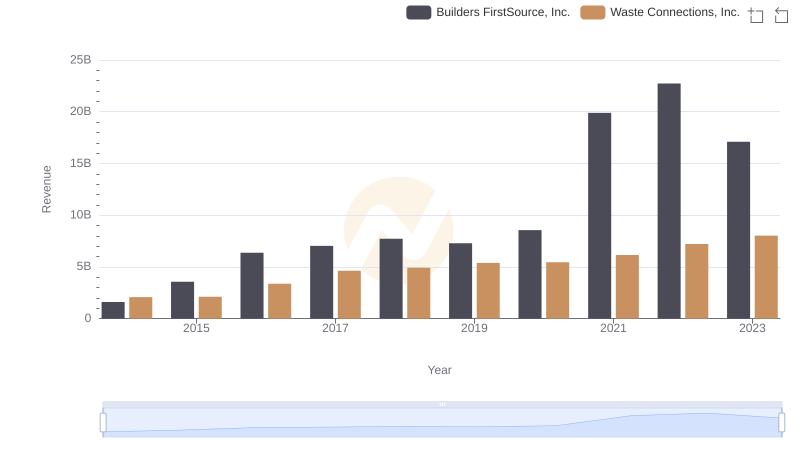
Who Generates More Revenue? Waste Connections, Inc. or Builders FirstSource, Inc.
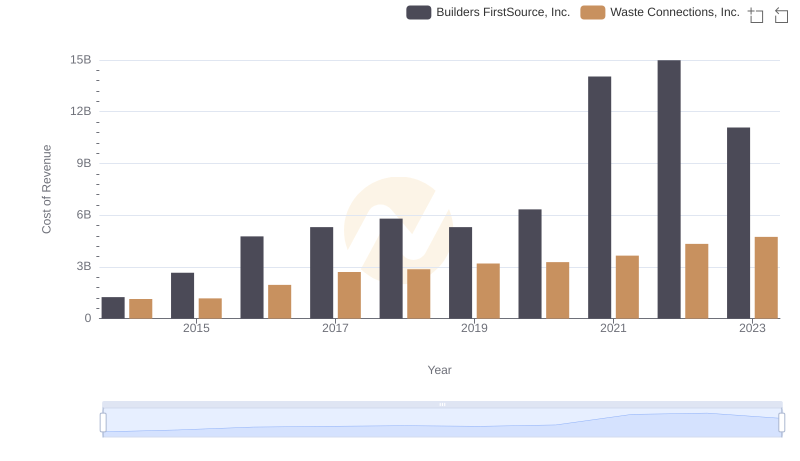
Comparing Cost of Revenue Efficiency: Waste Connections, Inc. vs Builders FirstSource, Inc.
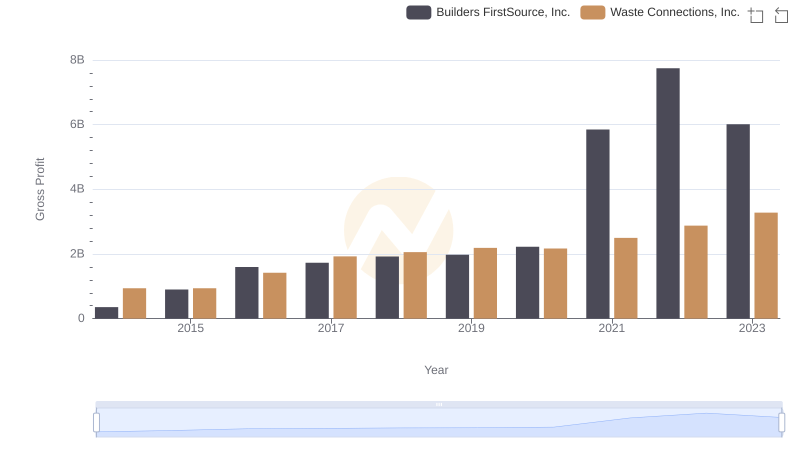
Key Insights on Gross Profit: Waste Connections, Inc. vs Builders FirstSource, Inc.
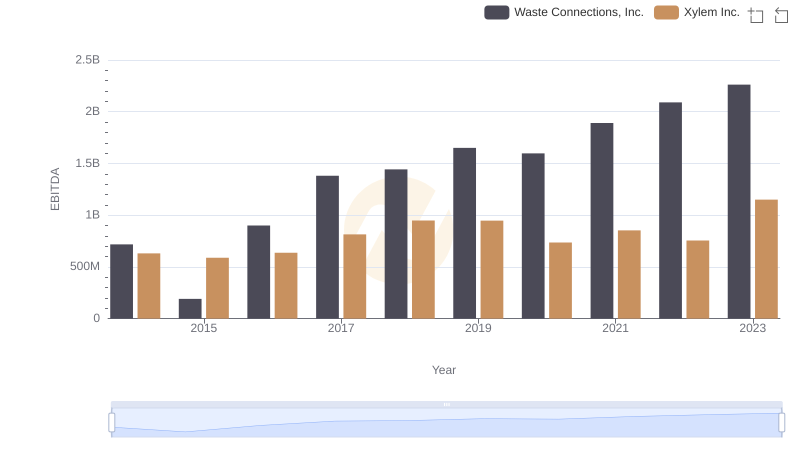
Comprehensive EBITDA Comparison: Waste Connections, Inc. vs Xylem Inc.
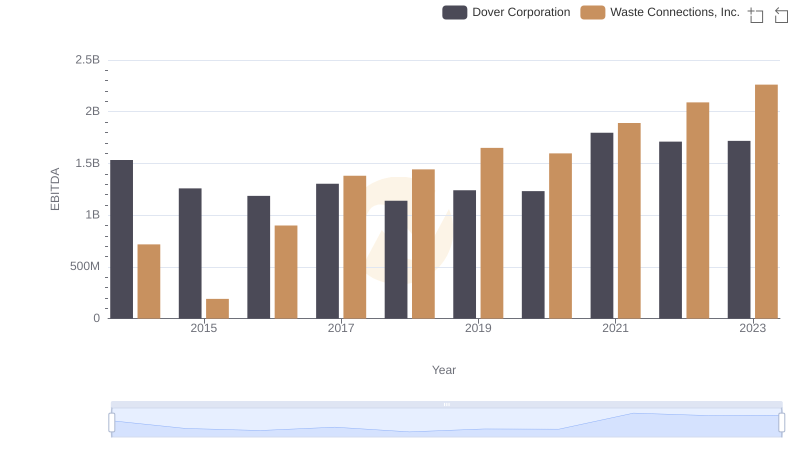
EBITDA Analysis: Evaluating Waste Connections, Inc. Against Dover Corporation
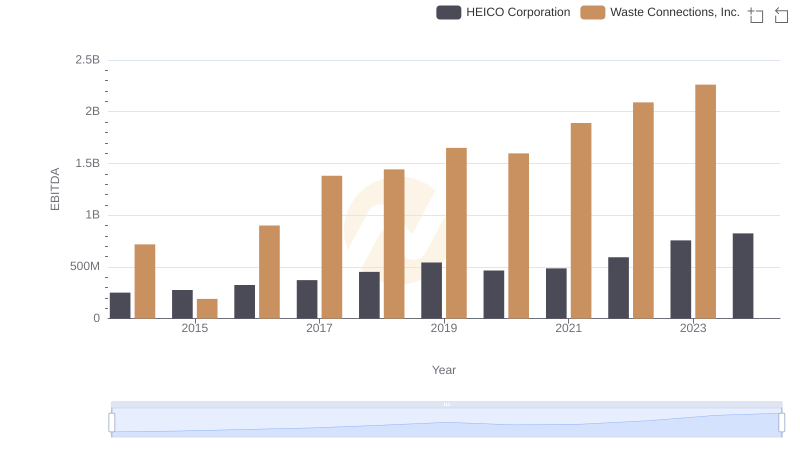
EBITDA Performance Review: Waste Connections, Inc. vs HEICO Corporation
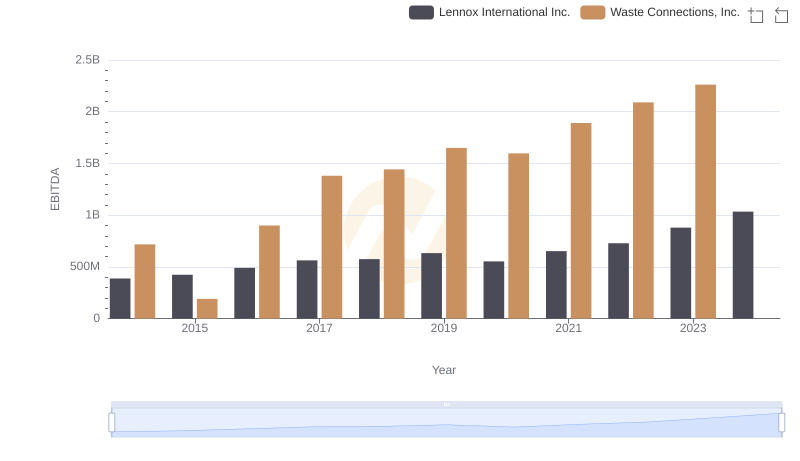
A Side-by-Side Analysis of EBITDA: Waste Connections, Inc. and Lennox International Inc.
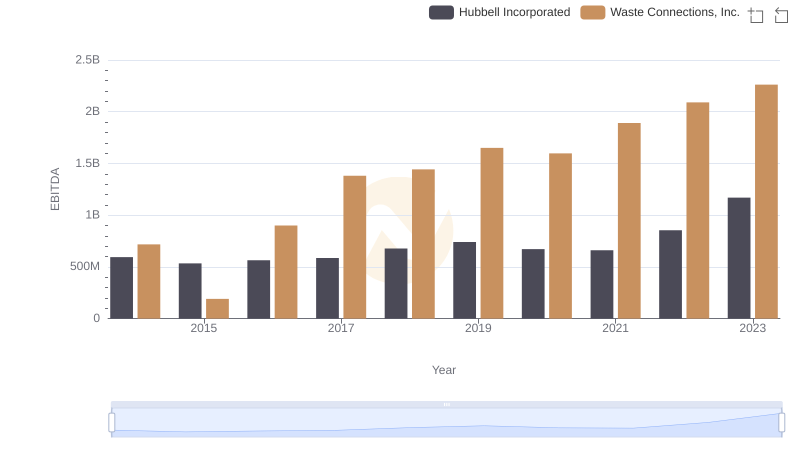
Waste Connections, Inc. vs Hubbell Incorporated: In-Depth EBITDA Performance Comparison
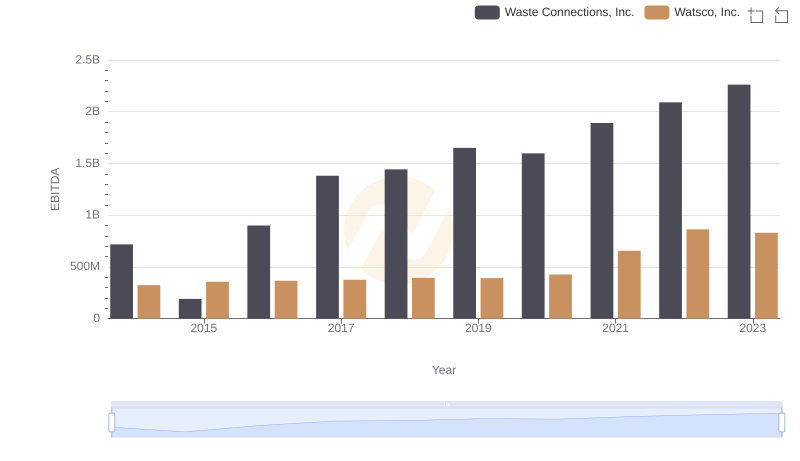
EBITDA Analysis: Evaluating Waste Connections, Inc. Against Watsco, Inc.