| __timestamp | Global Payments Inc. | Stanley Black & Decker, Inc. |
|---|---|---|
| Wednesday, January 1, 2014 | 1022107000 | 7235900000 |
| Thursday, January 1, 2015 | 1147639000 | 7099800000 |
| Friday, January 1, 2016 | 1603532000 | 7139700000 |
| Sunday, January 1, 2017 | 1928037000 | 7969200000 |
| Monday, January 1, 2018 | 1095014000 | 9080500000 |
| Tuesday, January 1, 2019 | 2073803000 | 9636700000 |
| Wednesday, January 1, 2020 | 3650727000 | 9566700000 |
| Friday, January 1, 2021 | 3773725000 | 10423000000 |
| Saturday, January 1, 2022 | 3778617000 | 12663300000 |
| Sunday, January 1, 2023 | 3727521000 | 11683100000 |
| Monday, January 1, 2024 | 3760116000 | 10851300000 |
Data in motion
In the ever-evolving landscape of global commerce, understanding cost structures is pivotal. Over the past decade, Global Payments Inc. and Stanley Black & Decker, Inc. have showcased intriguing trends in their cost of revenue. From 2014 to 2023, Global Payments Inc. saw a staggering 265% increase in its cost of revenue, peaking in 2022. This reflects the company's aggressive expansion and adaptation to digital payment solutions. In contrast, Stanley Black & Decker, Inc. experienced a more modest 63% rise, with a notable surge in 2022, indicating strategic investments in manufacturing and innovation. The data reveals a tale of two industries: one driven by digital transformation, the other by tangible goods. As we delve into these trends, it becomes evident that understanding cost dynamics is crucial for stakeholders aiming to navigate the complexities of modern business.
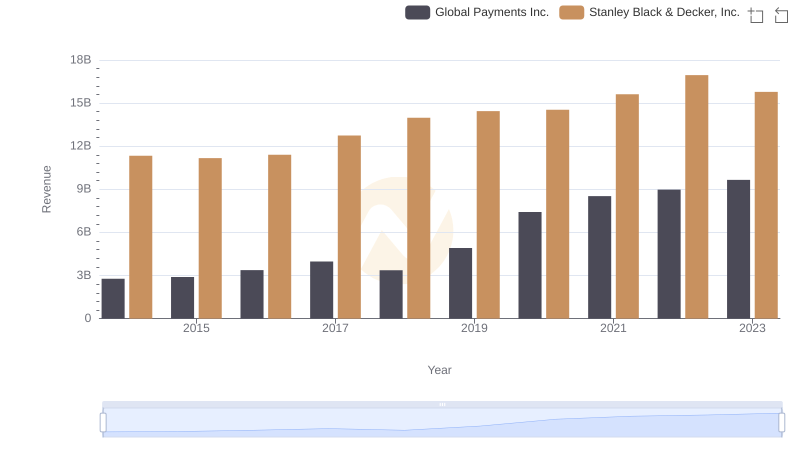
Global Payments Inc. vs Stanley Black & Decker, Inc.: Examining Key Revenue Metrics
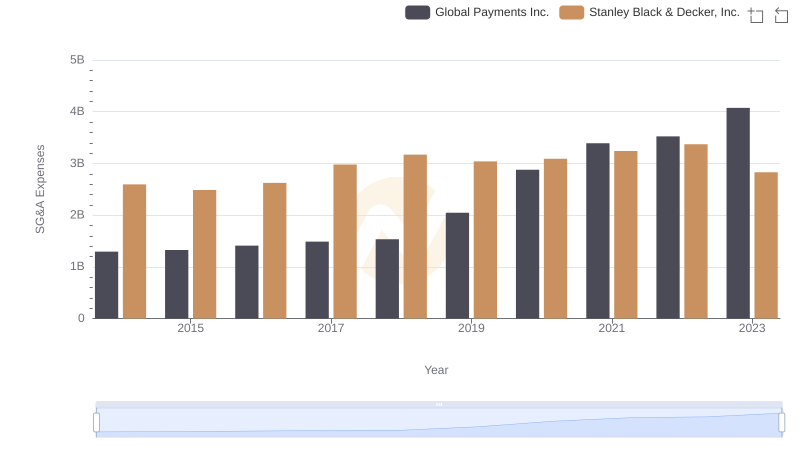
Breaking Down SG&A Expenses: Global Payments Inc. vs Stanley Black & Decker, Inc.
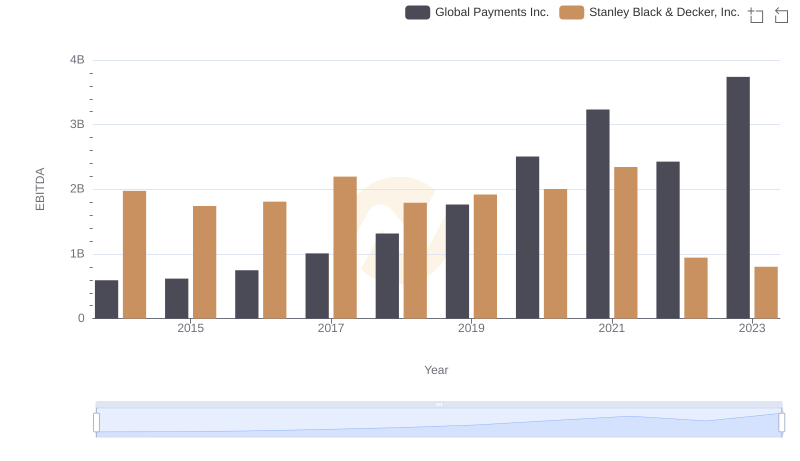
EBITDA Metrics Evaluated: Global Payments Inc. vs Stanley Black & Decker, Inc.

Revenue Insights: Global Payments Inc. and Stanley Black & Decker, Inc. Performance Compared

Comparing Cost of Revenue Efficiency: Global Payments Inc. vs AECOM
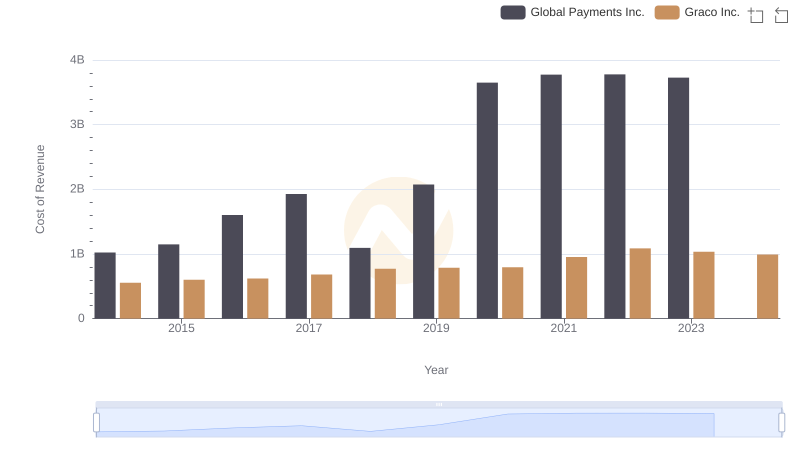
Analyzing Cost of Revenue: Global Payments Inc. and Graco Inc.
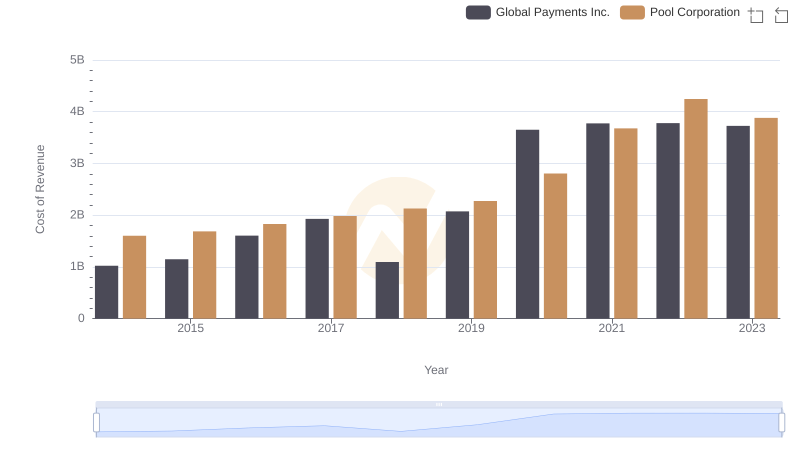
Global Payments Inc. vs Pool Corporation: Efficiency in Cost of Revenue Explored

Breaking Down SG&A Expenses: Global Payments Inc. vs Stanley Black & Decker, Inc.

Comprehensive EBITDA Comparison: Global Payments Inc. vs Stanley Black & Decker, Inc.