| __timestamp | Equifax Inc. | Ferrovial SE |
|---|---|---|
| Wednesday, January 1, 2014 | 842400000 | 983000000 |
| Thursday, January 1, 2015 | 914600000 | 1027000000 |
| Friday, January 1, 2016 | 1116900000 | 943000000 |
| Sunday, January 1, 2017 | 1013900000 | 515000000 |
| Monday, January 1, 2018 | 770200000 | 661000000 |
| Tuesday, January 1, 2019 | 29000000 | 121000000 |
| Wednesday, January 1, 2020 | 1217800000 | 116000000 |
| Friday, January 1, 2021 | 1575200000 | 610000000 |
| Saturday, January 1, 2022 | 1672800000 | 756000000 |
| Sunday, January 1, 2023 | 1579100000 | 1524000000 |
| Monday, January 1, 2024 | 1251200000 |
Igniting the spark of knowledge
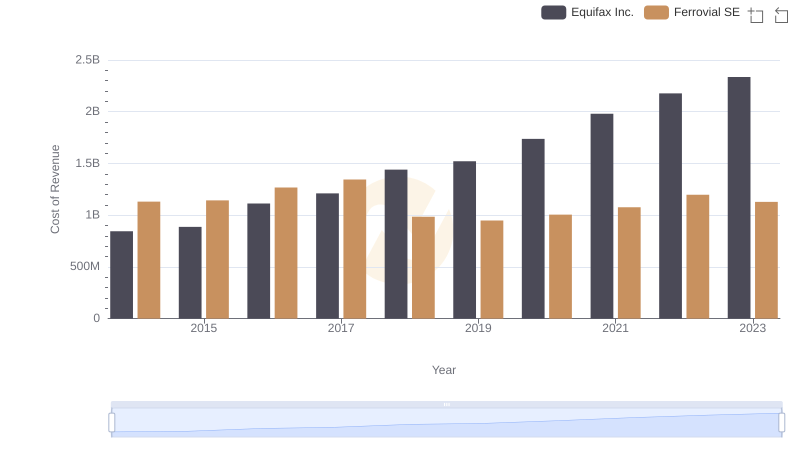
In the ever-evolving landscape of global finance, Equifax Inc. and Ferrovial SE have showcased intriguing EBITDA trends over the past decade. From 2014 to 2023, Equifax's EBITDA surged by approximately 87%, peaking in 2022. This growth trajectory highlights the company's resilience and strategic prowess, especially notable during the challenging year of 2019 when EBITDA plummeted to a mere 3% of its 2022 peak.
Conversely, Ferrovial SE experienced a more volatile journey. Despite a dip in 2017, the company rebounded, achieving a remarkable 198% increase in EBITDA by 2023. This recovery underscores Ferrovial's adaptability and robust market strategies.
These insights not only reflect the companies' financial health but also offer a window into their strategic maneuvers in a competitive market. As we look to the future, these trends provide a foundation for understanding potential growth trajectories.