| __timestamp | Cisco Systems, Inc. | KLA Corporation |
|---|---|---|
| Wednesday, January 1, 2014 | 19373000000 | 1232962000 |
| Thursday, January 1, 2015 | 19480000000 | 1215229000 |
| Friday, January 1, 2016 | 18287000000 | 1163391000 |
| Sunday, January 1, 2017 | 17781000000 | 1287547000 |
| Monday, January 1, 2018 | 18724000000 | 1447369000 |
| Tuesday, January 1, 2019 | 19238000000 | 1869377000 |
| Wednesday, January 1, 2020 | 17618000000 | 2449561000 |
| Friday, January 1, 2021 | 17924000000 | 2772165000 |
| Saturday, January 1, 2022 | 19309000000 | 3592441000 |
| Sunday, January 1, 2023 | 21245000000 | 4218307000 |
| Monday, January 1, 2024 | 18975000000 | 3928073000 |
Infusing magic into the data realm
In the ever-evolving tech industry, cost efficiency is a critical metric for success. This analysis delves into the cost of revenue trends for Cisco Systems, Inc. and KLA Corporation from 2014 to 2024. Cisco, a networking giant, consistently maintained a higher cost of revenue, peaking at approximately $21.2 billion in 2023. In contrast, KLA, a leader in semiconductor manufacturing, saw its cost of revenue grow significantly, reaching around $4.2 billion in the same year.
Over the decade, Cisco's cost of revenue fluctuated slightly, with a notable dip in 2020, reflecting a 7% decrease from the previous year. Meanwhile, KLA's cost of revenue surged by over 240% from 2014 to 2023, highlighting its aggressive expansion and increased operational scale. This comparison underscores the distinct operational strategies of these tech titans, offering valuable insights into their financial health and market positioning.

Cost of Revenue Trends: Cisco Systems, Inc. vs Palo Alto Networks, Inc.
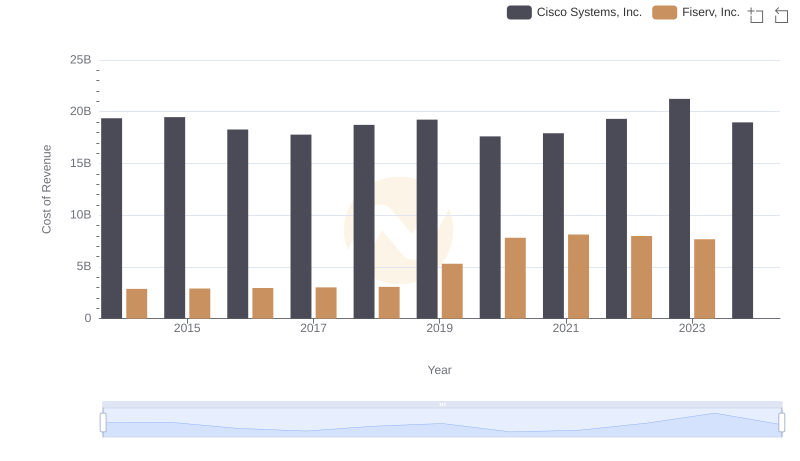
Cost of Revenue Comparison: Cisco Systems, Inc. vs Fiserv, Inc.
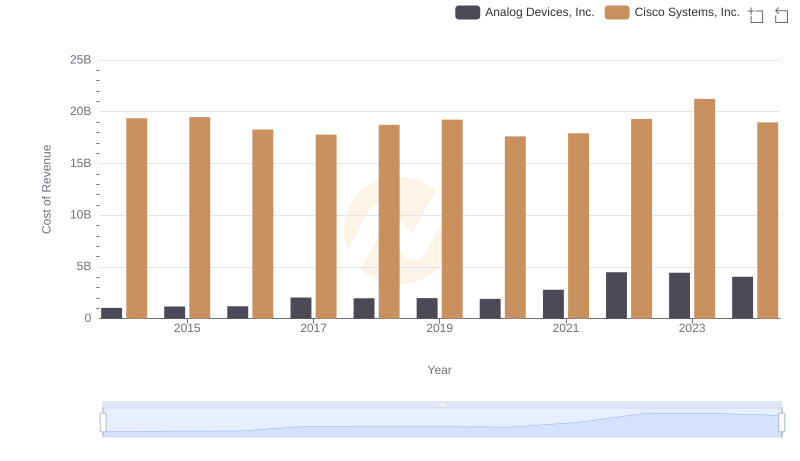
Comparing Cost of Revenue Efficiency: Cisco Systems, Inc. vs Analog Devices, Inc.
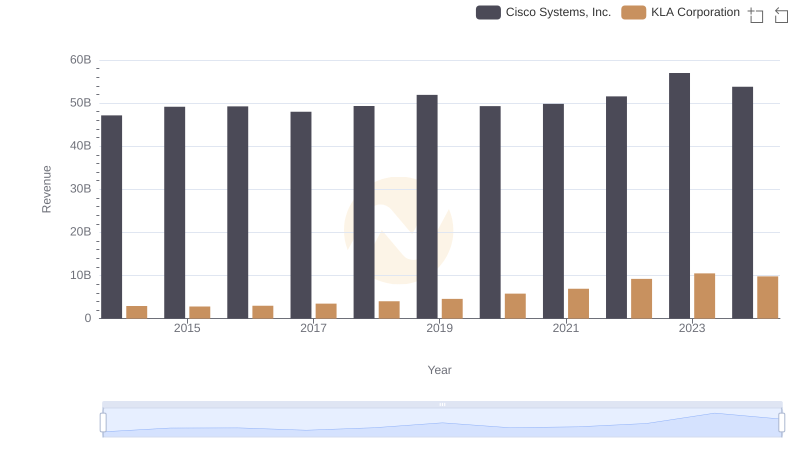
Cisco Systems, Inc. vs KLA Corporation: Annual Revenue Growth Compared
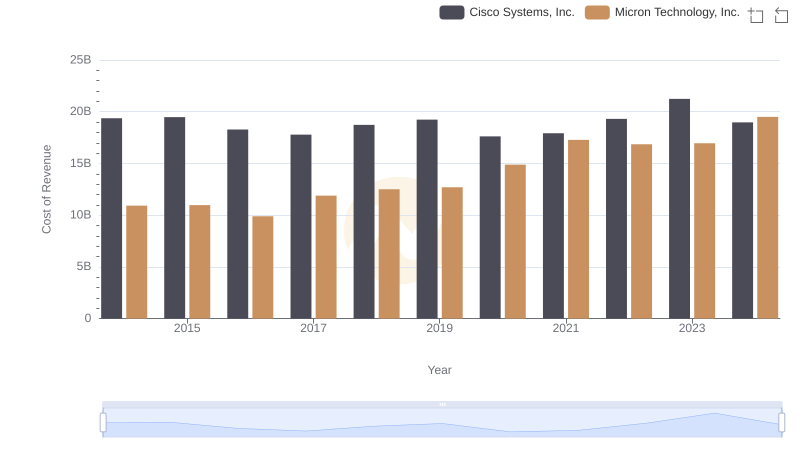
Analyzing Cost of Revenue: Cisco Systems, Inc. and Micron Technology, Inc.
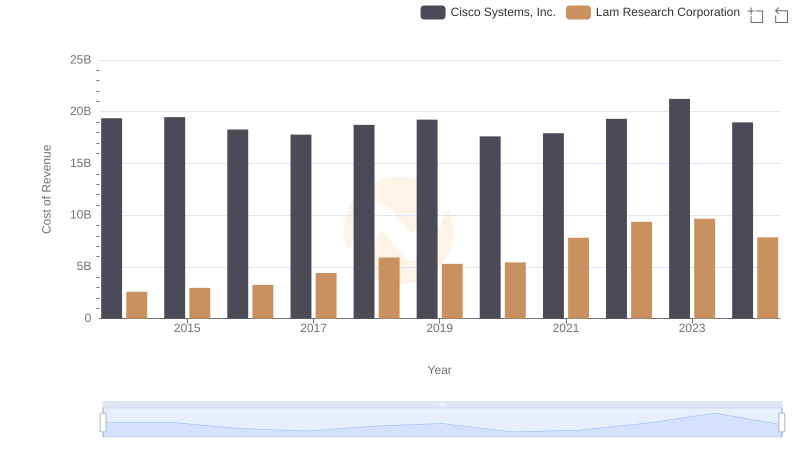
Analyzing Cost of Revenue: Cisco Systems, Inc. and Lam Research Corporation
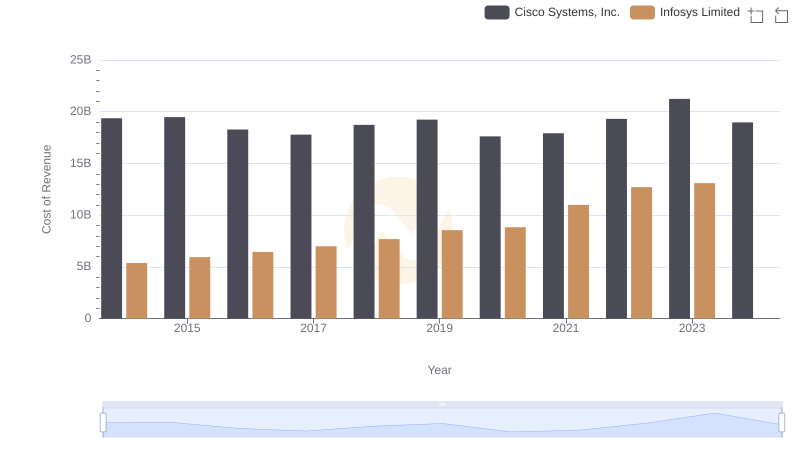
Cost of Revenue: Key Insights for Cisco Systems, Inc. and Infosys Limited
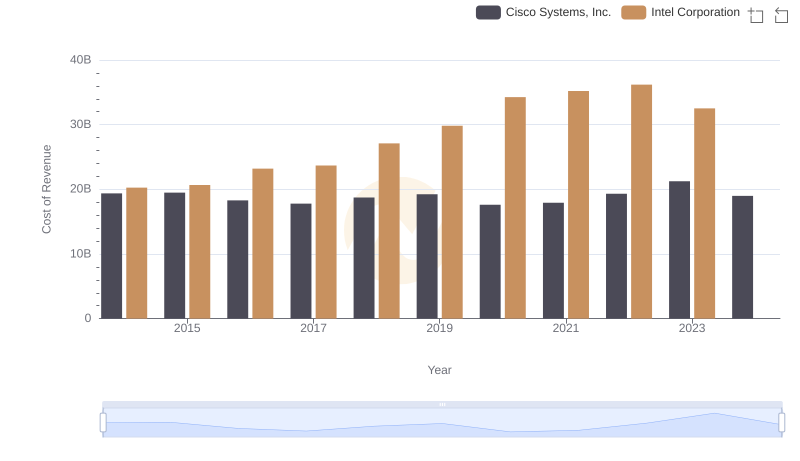
Comparing Cost of Revenue Efficiency: Cisco Systems, Inc. vs Intel Corporation
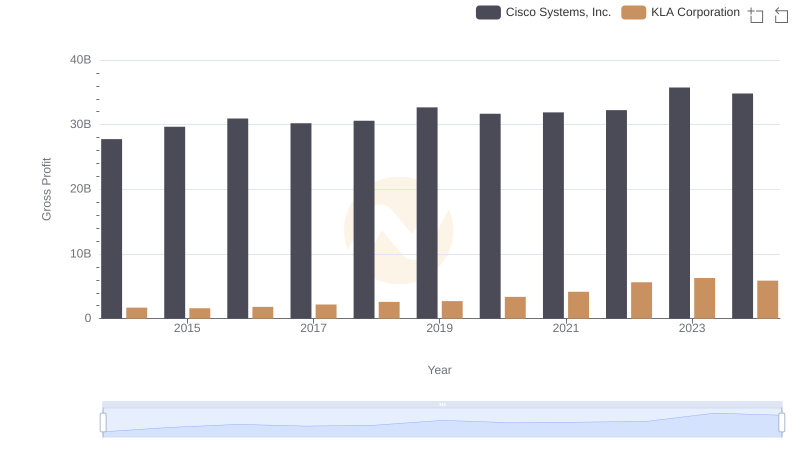
Gross Profit Comparison: Cisco Systems, Inc. and KLA Corporation Trends
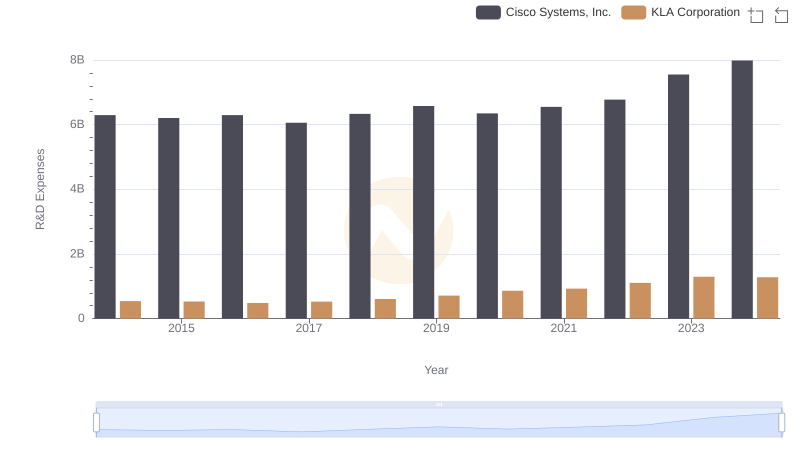
R&D Insights: How Cisco Systems, Inc. and KLA Corporation Allocate Funds
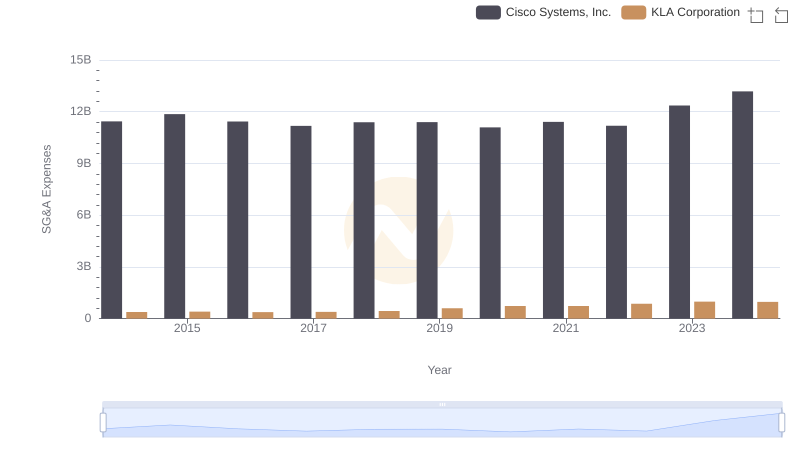
Who Optimizes SG&A Costs Better? Cisco Systems, Inc. or KLA Corporation
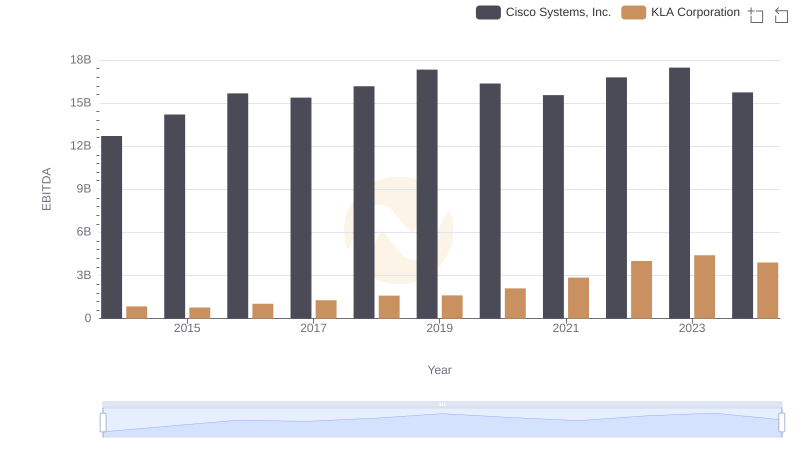
A Professional Review of EBITDA: Cisco Systems, Inc. Compared to KLA Corporation