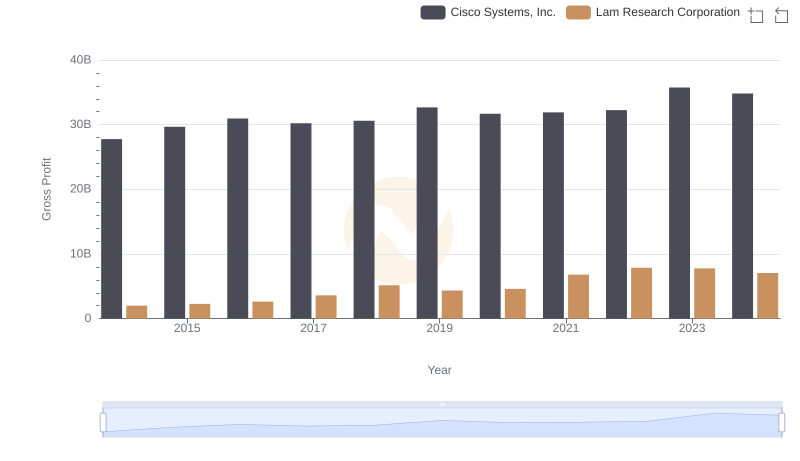
| __timestamp | Cisco Systems, Inc. | Lam Research Corporation |
|---|---|---|
| Wednesday, January 1, 2014 | 19373000000 | 2599828000 |
| Thursday, January 1, 2015 | 19480000000 | 2974976000 |
| Friday, January 1, 2016 | 18287000000 | 3266971000 |
| Sunday, January 1, 2017 | 17781000000 | 4410261000 |
| Monday, January 1, 2018 | 18724000000 | 5911966000 |
| Tuesday, January 1, 2019 | 19238000000 | 5295100000 |
| Wednesday, January 1, 2020 | 17618000000 | 5436043000 |
| Friday, January 1, 2021 | 17924000000 | 7820844000 |
| Saturday, January 1, 2022 | 19309000000 | 9355232000 |
| Sunday, January 1, 2023 | 21245000000 | 9651591000 |
| Monday, January 1, 2024 | 18975000000 | 7852595000 |
Unleashing insights
In the ever-evolving tech industry, understanding the cost of revenue is crucial for evaluating a company's financial health. Cisco Systems, Inc. and Lam Research Corporation, two giants in their respective fields, have shown distinct trends over the past decade. From 2014 to 2023, Cisco's cost of revenue has remained relatively stable, averaging around $19 billion annually, with a slight dip in 2020. In contrast, Lam Research has experienced a significant upward trajectory, with costs rising from approximately $2.6 billion in 2014 to nearly $9.7 billion in 2023, marking a staggering 270% increase. This growth reflects Lam's expanding market presence and increased production costs. As we look to 2024, Cisco's costs are projected to stabilize, while Lam's costs show a slight decrease, indicating potential efficiency improvements. These insights provide a window into the strategic financial maneuvers of these tech titans.

Cost of Revenue Trends: Cisco Systems, Inc. vs Palo Alto Networks, Inc.
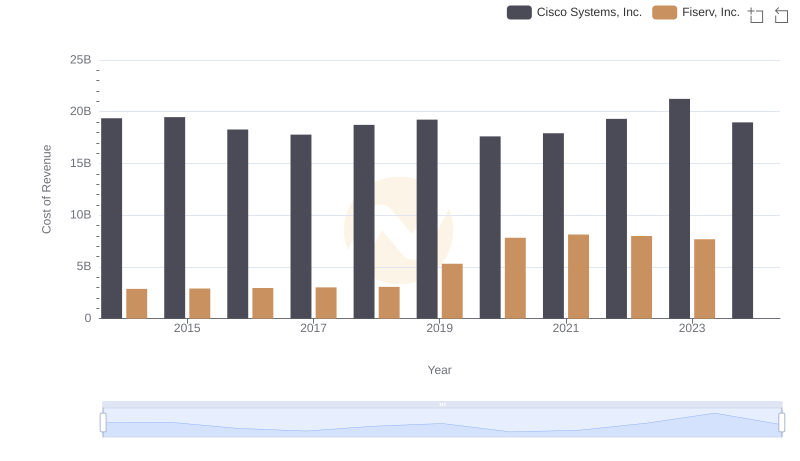
Cost of Revenue Comparison: Cisco Systems, Inc. vs Fiserv, Inc.
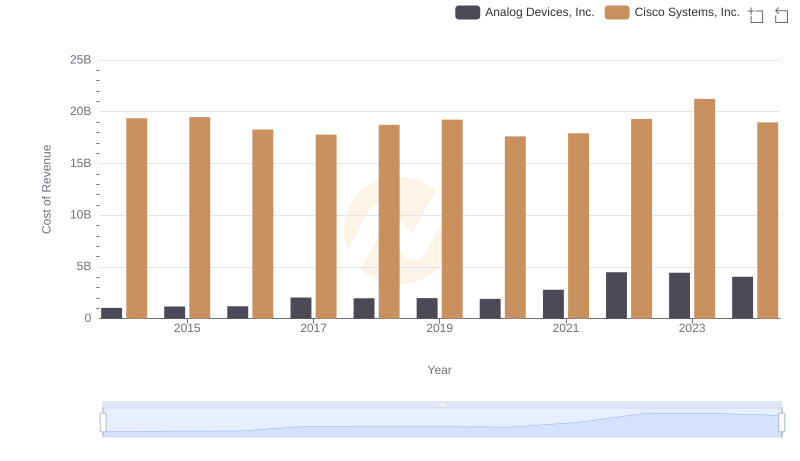
Comparing Cost of Revenue Efficiency: Cisco Systems, Inc. vs Analog Devices, Inc.
Cisco Systems, Inc. or Lam Research Corporation: Who Leads in Yearly Revenue?
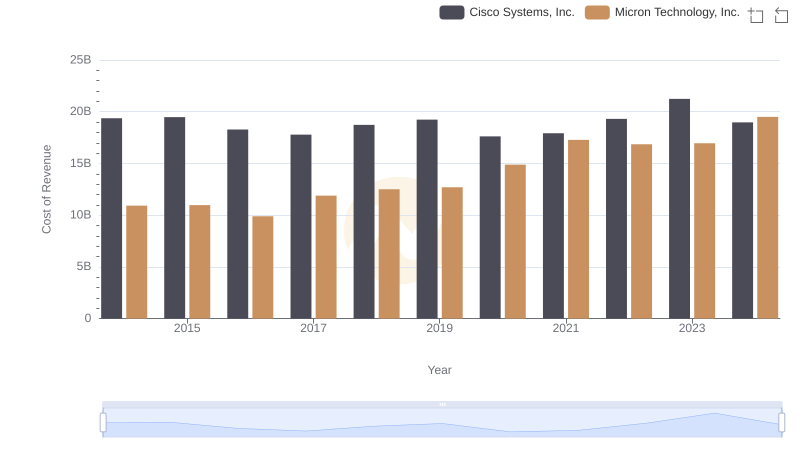
Analyzing Cost of Revenue: Cisco Systems, Inc. and Micron Technology, Inc.
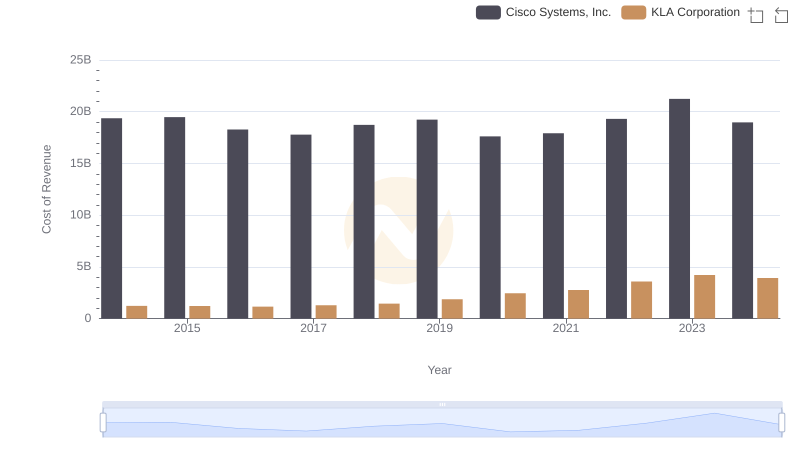
Cisco Systems, Inc. vs KLA Corporation: Efficiency in Cost of Revenue Explored
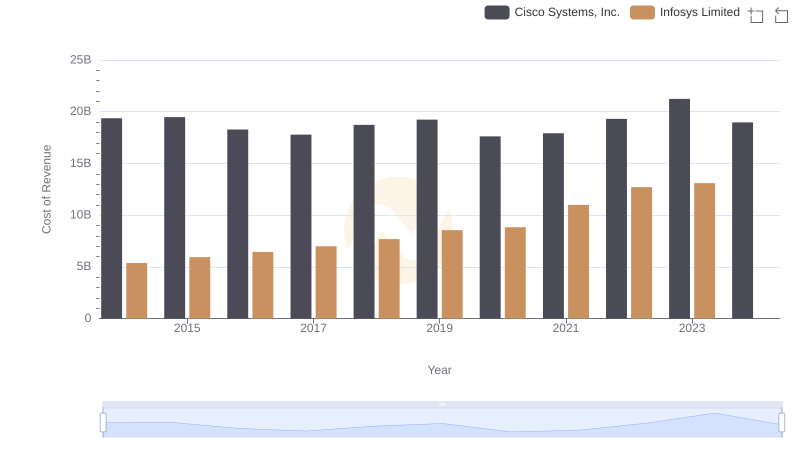
Cost of Revenue: Key Insights for Cisco Systems, Inc. and Infosys Limited
Who Generates Higher Gross Profit? Cisco Systems, Inc. or Lam Research Corporation
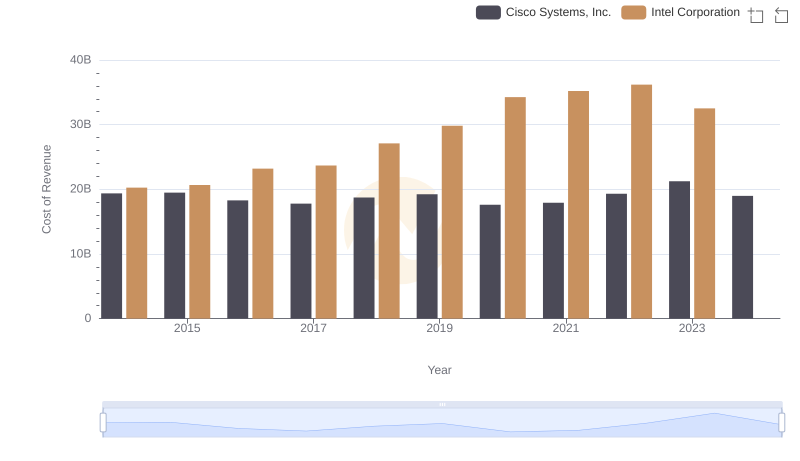
Comparing Cost of Revenue Efficiency: Cisco Systems, Inc. vs Intel Corporation
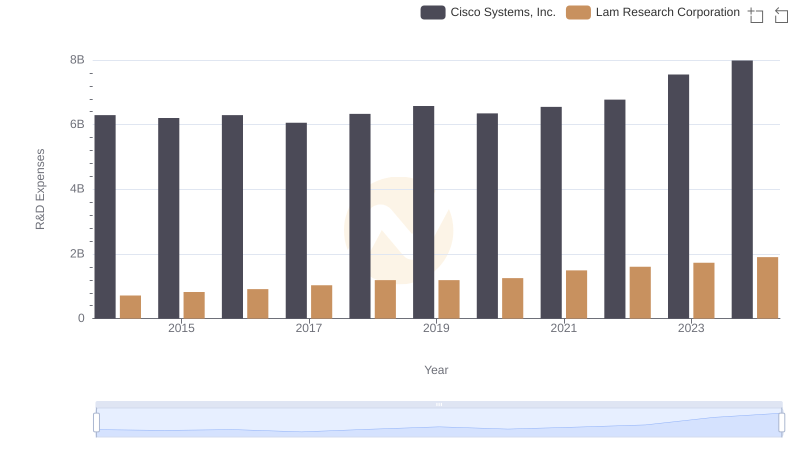
Research and Development Investment: Cisco Systems, Inc. vs Lam Research Corporation
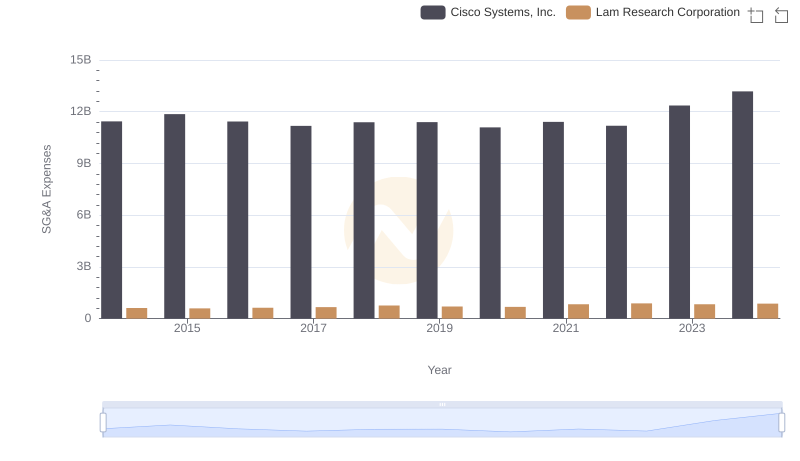
Who Optimizes SG&A Costs Better? Cisco Systems, Inc. or Lam Research Corporation
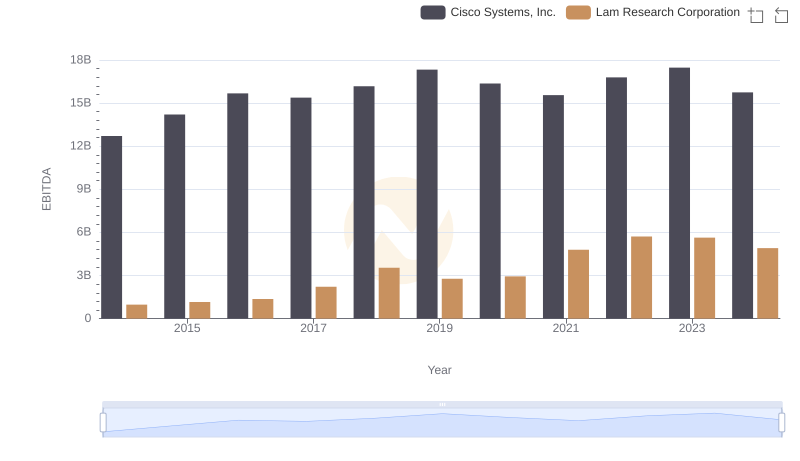
Professional EBITDA Benchmarking: Cisco Systems, Inc. vs Lam Research Corporation