| __timestamp | Cisco Systems, Inc. | MicroStrategy Incorporated |
|---|---|---|
| Wednesday, January 1, 2014 | 19373000000 | 135210000 |
| Thursday, January 1, 2015 | 19480000000 | 101108000 |
| Friday, January 1, 2016 | 18287000000 | 93147000 |
| Sunday, January 1, 2017 | 17781000000 | 96649000 |
| Monday, January 1, 2018 | 18724000000 | 99499000 |
| Tuesday, January 1, 2019 | 19238000000 | 99974000 |
| Wednesday, January 1, 2020 | 17618000000 | 91055000 |
| Friday, January 1, 2021 | 17924000000 | 91909000 |
| Saturday, January 1, 2022 | 19309000000 | 102989000 |
| Sunday, January 1, 2023 | 21245000000 | 109944000 |
| Monday, January 1, 2024 | 18975000000 | 129468000 |
Unlocking the unknown
In the ever-evolving landscape of technology, understanding the cost of revenue is crucial for evaluating a company's financial health. Cisco Systems, Inc., a leader in networking solutions, and MicroStrategy Incorporated, a prominent business intelligence firm, offer intriguing insights into their financial strategies over the past decade.
From 2014 to 2023, Cisco's cost of revenue fluctuated, peaking in 2023 with a 10% increase from 2022, reaching its highest point. In contrast, MicroStrategy's cost of revenue remained relatively stable, with a notable 8% rise in 2023 compared to the previous year. This stability reflects MicroStrategy's consistent operational efficiency, despite the dynamic market conditions.
Interestingly, the data for 2024 is incomplete, highlighting the need for ongoing analysis. These insights underscore the importance of strategic cost management in maintaining competitive advantage in the tech industry.
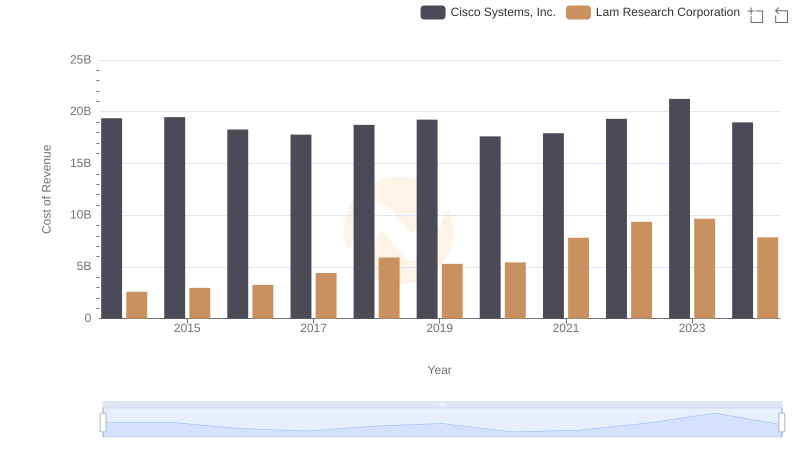
Analyzing Cost of Revenue: Cisco Systems, Inc. and Lam Research Corporation
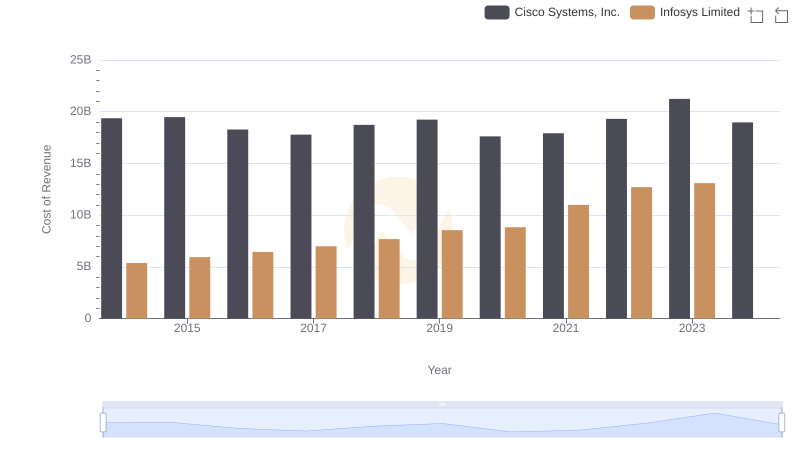
Cost of Revenue: Key Insights for Cisco Systems, Inc. and Infosys Limited
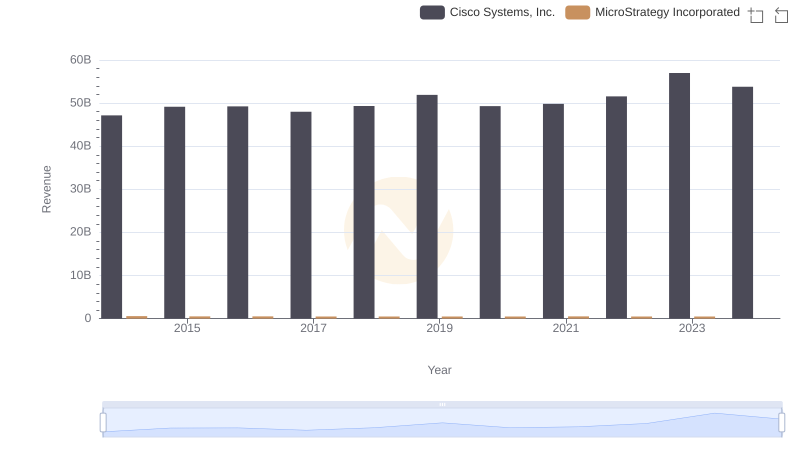
Cisco Systems, Inc. and MicroStrategy Incorporated: A Comprehensive Revenue Analysis
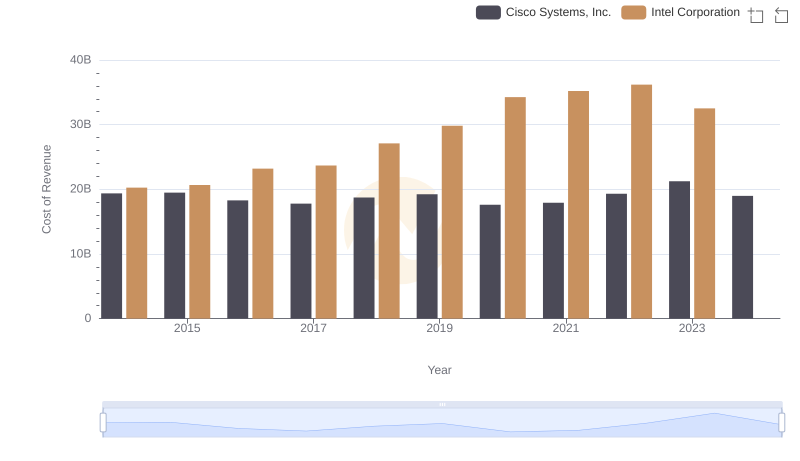
Comparing Cost of Revenue Efficiency: Cisco Systems, Inc. vs Intel Corporation
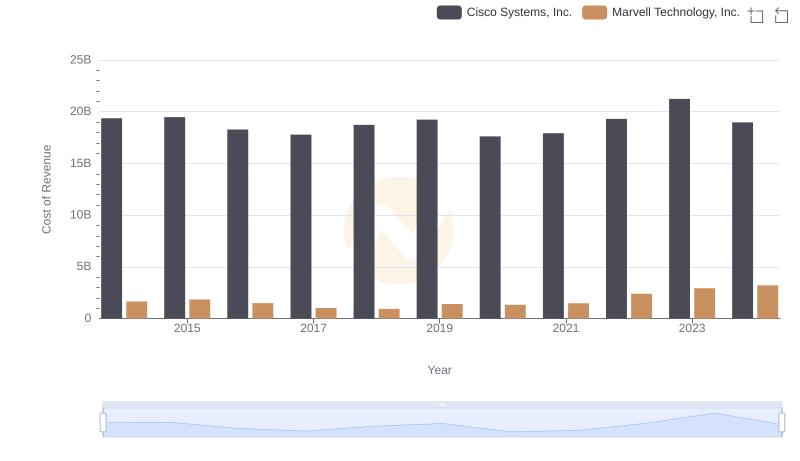
Comparing Cost of Revenue Efficiency: Cisco Systems, Inc. vs Marvell Technology, Inc.
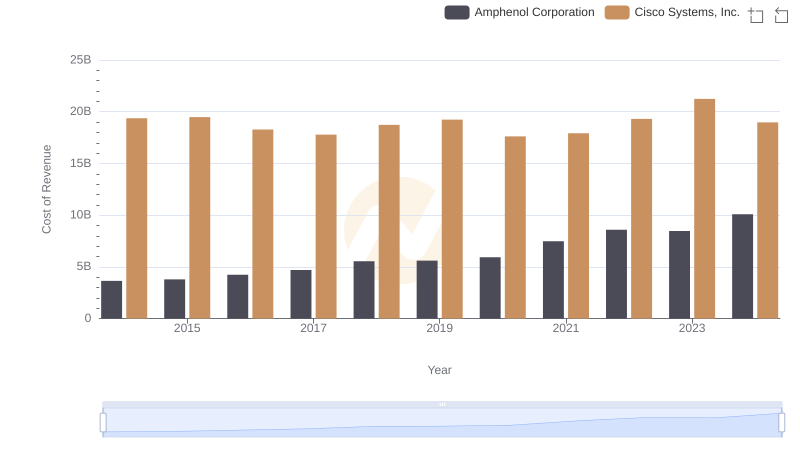
Cost of Revenue Trends: Cisco Systems, Inc. vs Amphenol Corporation
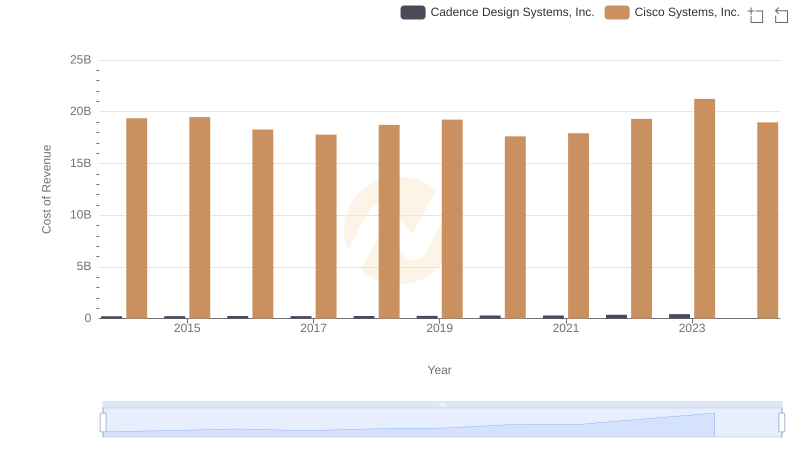
Cost of Revenue: Key Insights for Cisco Systems, Inc. and Cadence Design Systems, Inc.
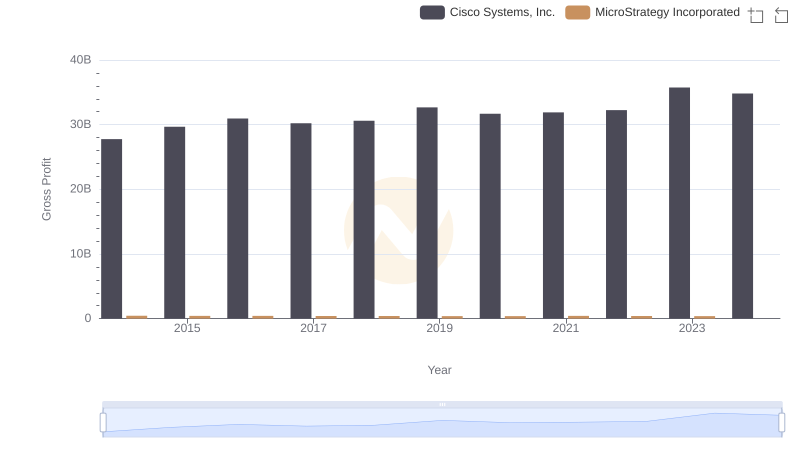
Cisco Systems, Inc. vs MicroStrategy Incorporated: A Gross Profit Performance Breakdown
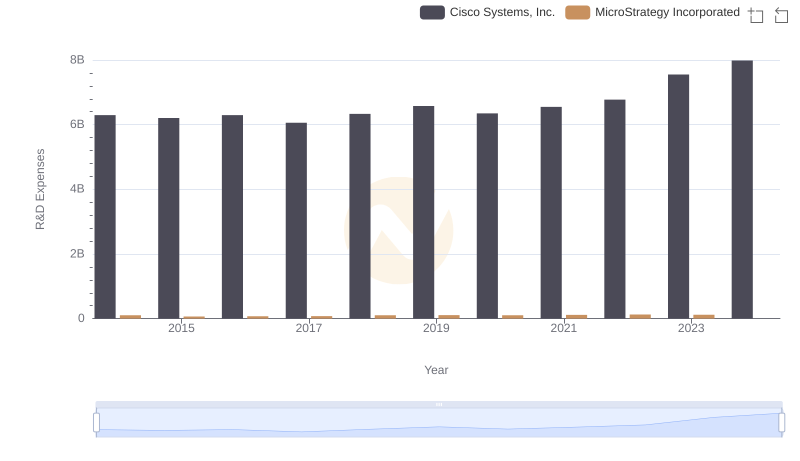
R&D Spending Showdown: Cisco Systems, Inc. vs MicroStrategy Incorporated
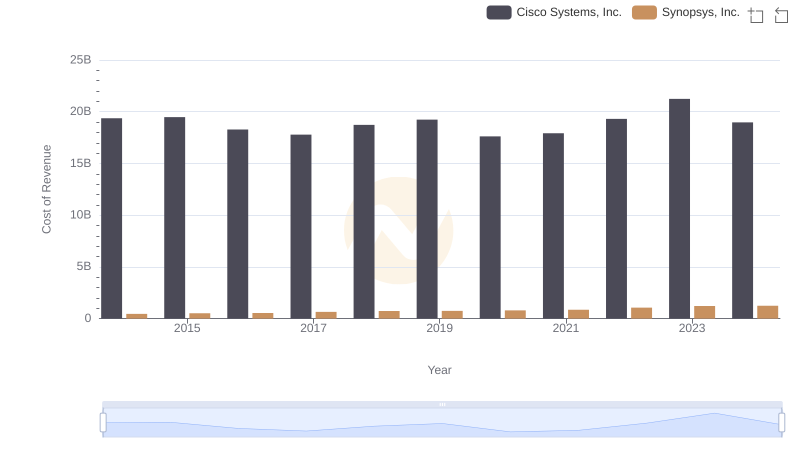
Cost of Revenue: Key Insights for Cisco Systems, Inc. and Synopsys, Inc.
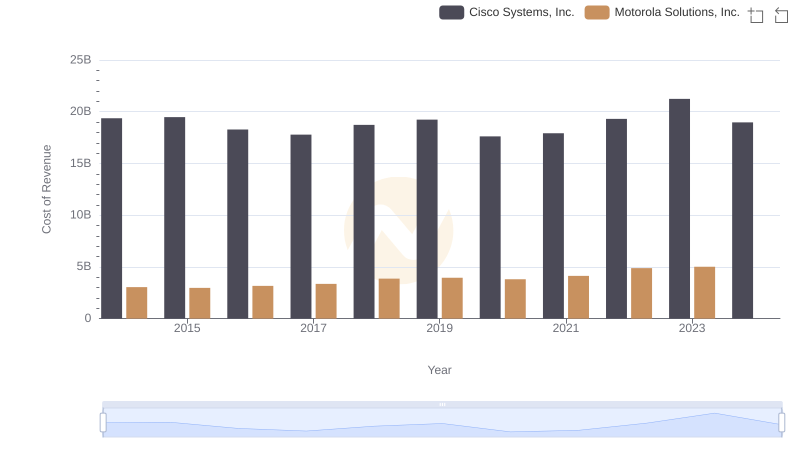
Cost of Revenue Comparison: Cisco Systems, Inc. vs Motorola Solutions, Inc.
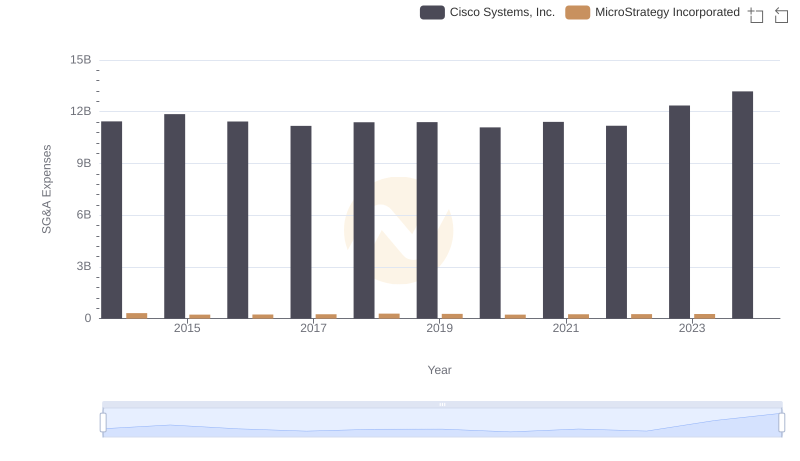
Comparing SG&A Expenses: Cisco Systems, Inc. vs MicroStrategy Incorporated Trends and Insights