| __timestamp | Amphenol Corporation | Cisco Systems, Inc. |
|---|---|---|
| Wednesday, January 1, 2014 | 3651700000 | 19373000000 |
| Thursday, January 1, 2015 | 3789200000 | 19480000000 |
| Friday, January 1, 2016 | 4246400000 | 18287000000 |
| Sunday, January 1, 2017 | 4701400000 | 17781000000 |
| Monday, January 1, 2018 | 5547100000 | 18724000000 |
| Tuesday, January 1, 2019 | 5609400000 | 19238000000 |
| Wednesday, January 1, 2020 | 5934800000 | 17618000000 |
| Friday, January 1, 2021 | 7474500000 | 17924000000 |
| Saturday, January 1, 2022 | 8594800000 | 19309000000 |
| Sunday, January 1, 2023 | 8470600000 | 21245000000 |
| Monday, January 1, 2024 | 10083000000 | 18975000000 |
Unleashing insights
In the ever-evolving tech landscape, Cisco Systems, Inc. and Amphenol Corporation have carved distinct paths. From 2014 to 2024, Cisco's cost of revenue has shown a steady trend, peaking in 2023 with a 13% increase from its 2014 figures. Meanwhile, Amphenol's cost of revenue has surged by an impressive 176% over the same period, reflecting its aggressive growth strategy.
Cisco's cost of revenue has remained relatively stable, with minor fluctuations. The company's strategic focus on maintaining operational efficiency is evident, as it navigates the complexities of the global market.
Amphenol's trajectory tells a different story. With a consistent upward trend, the company has expanded its market presence, showcasing its adaptability and innovation in the tech sector.
This comparison highlights the diverse strategies of two industry leaders, offering insights into their financial health and market positioning.
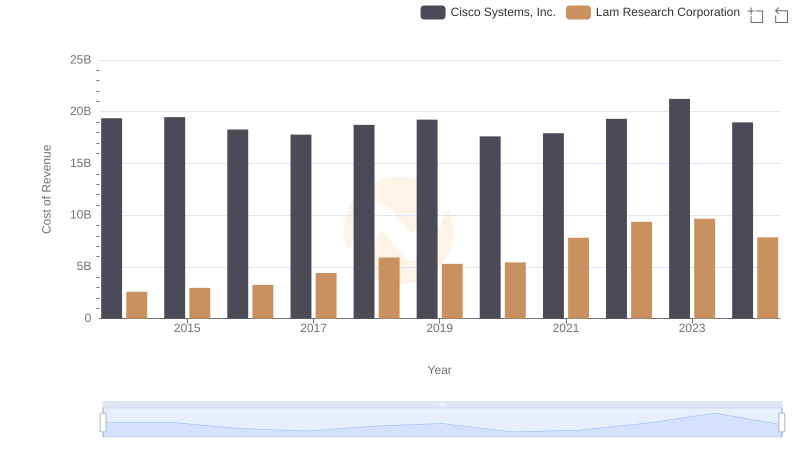
Analyzing Cost of Revenue: Cisco Systems, Inc. and Lam Research Corporation
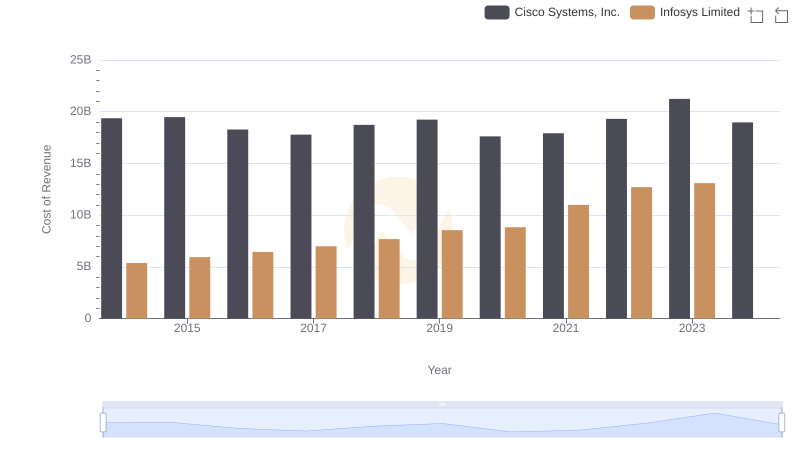
Cost of Revenue: Key Insights for Cisco Systems, Inc. and Infosys Limited
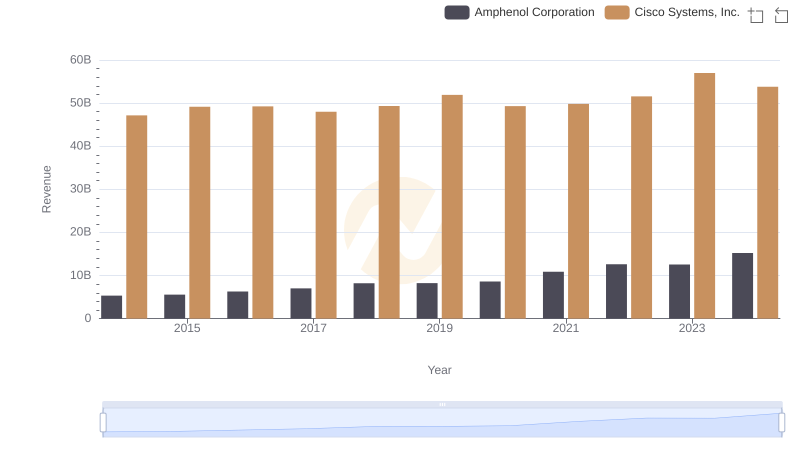
Cisco Systems, Inc. or Amphenol Corporation: Who Leads in Yearly Revenue?
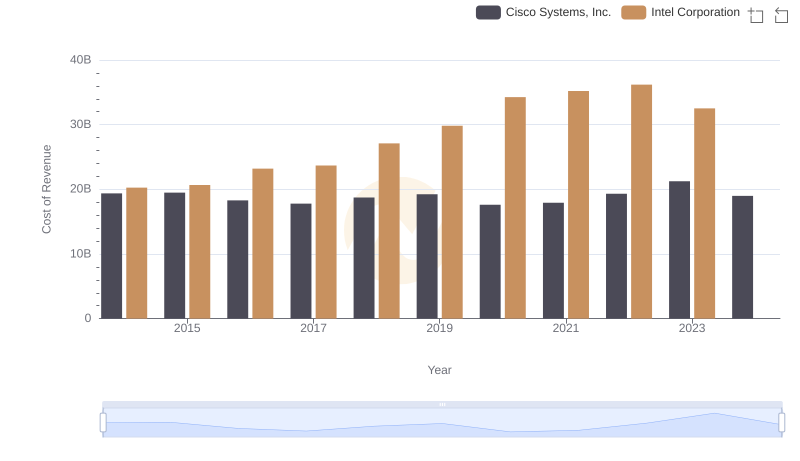
Comparing Cost of Revenue Efficiency: Cisco Systems, Inc. vs Intel Corporation
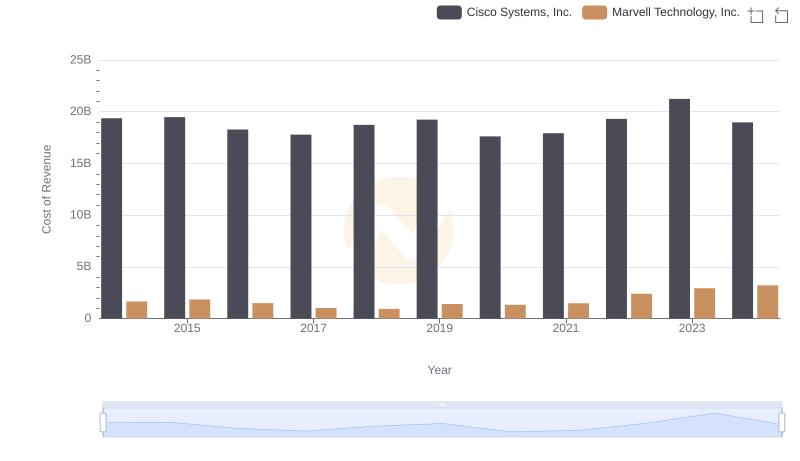
Comparing Cost of Revenue Efficiency: Cisco Systems, Inc. vs Marvell Technology, Inc.
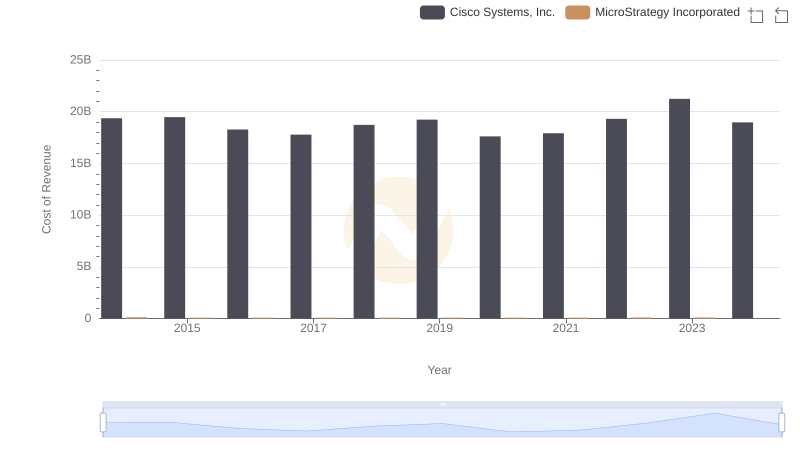
Cost of Revenue: Key Insights for Cisco Systems, Inc. and MicroStrategy Incorporated
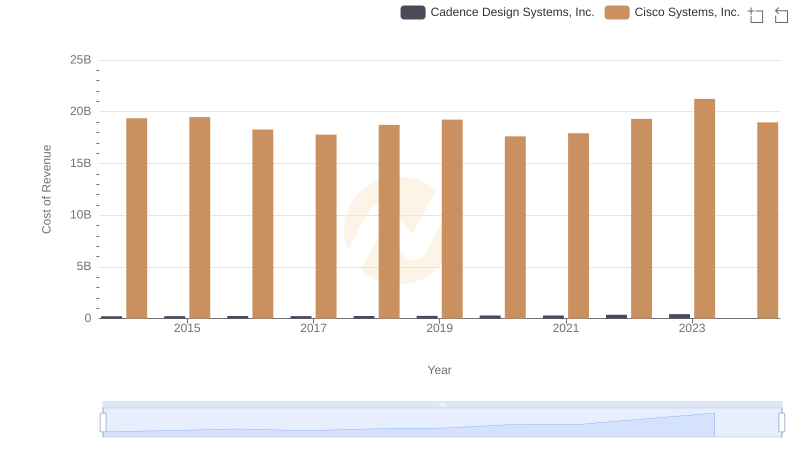
Cost of Revenue: Key Insights for Cisco Systems, Inc. and Cadence Design Systems, Inc.
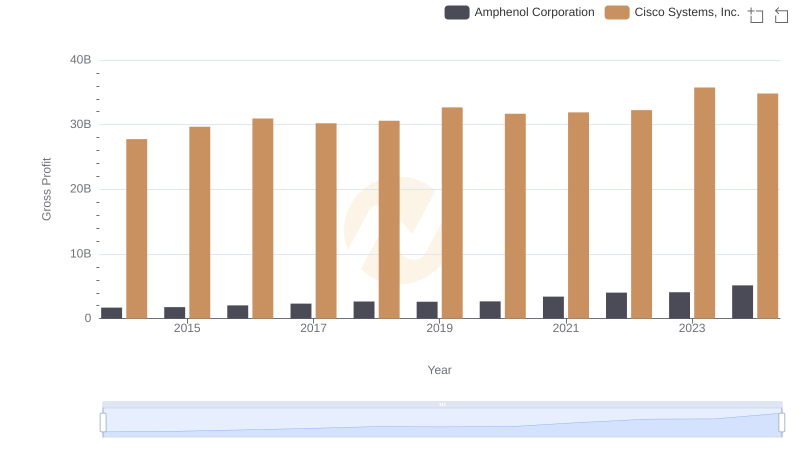
Key Insights on Gross Profit: Cisco Systems, Inc. vs Amphenol Corporation
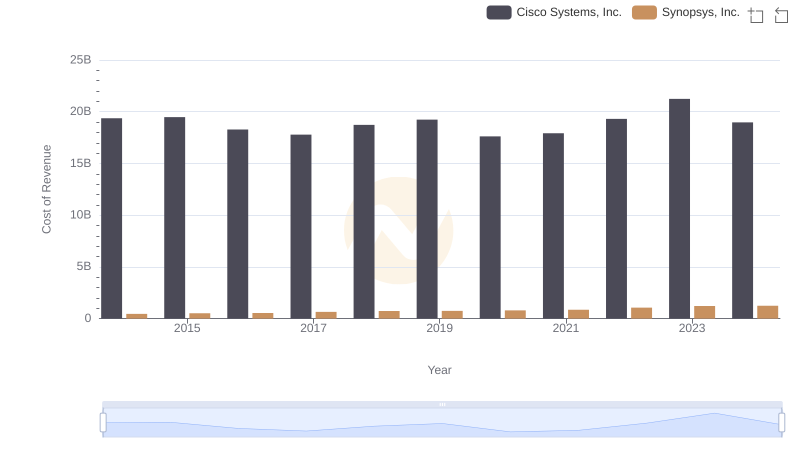
Cost of Revenue: Key Insights for Cisco Systems, Inc. and Synopsys, Inc.
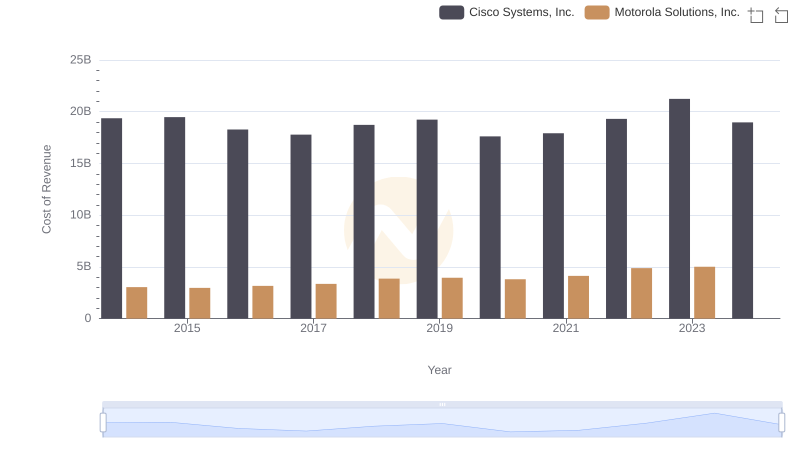
Cost of Revenue Comparison: Cisco Systems, Inc. vs Motorola Solutions, Inc.
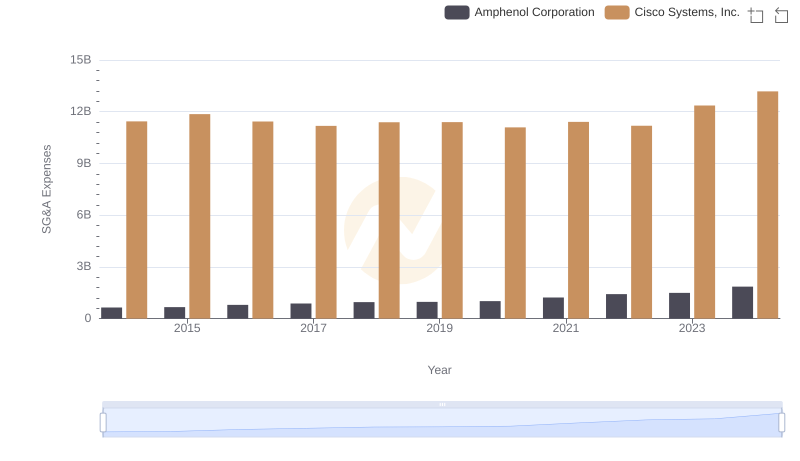
Operational Costs Compared: SG&A Analysis of Cisco Systems, Inc. and Amphenol Corporation
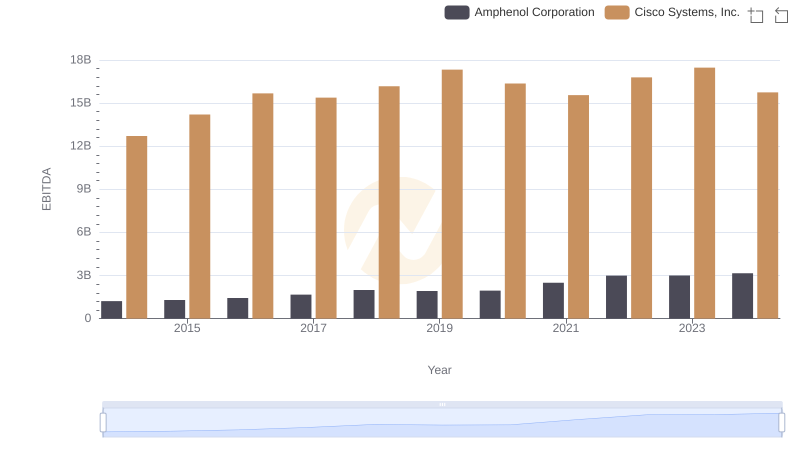
Comprehensive EBITDA Comparison: Cisco Systems, Inc. vs Amphenol Corporation