| __timestamp | Cisco Systems, Inc. | Infosys Limited |
|---|---|---|
| Wednesday, January 1, 2014 | 19373000000 | 5374000000 |
| Thursday, January 1, 2015 | 19480000000 | 5950000000 |
| Friday, January 1, 2016 | 18287000000 | 6446000000 |
| Sunday, January 1, 2017 | 17781000000 | 7001000000 |
| Monday, January 1, 2018 | 18724000000 | 7687000000 |
| Tuesday, January 1, 2019 | 19238000000 | 8552000000 |
| Wednesday, January 1, 2020 | 17618000000 | 8828000000 |
| Friday, January 1, 2021 | 17924000000 | 10996000000 |
| Saturday, January 1, 2022 | 19309000000 | 12709000000 |
| Sunday, January 1, 2023 | 21245000000 | 13096000000 |
| Monday, January 1, 2024 | 18975000000 |
Data in motion
In the ever-evolving tech industry, understanding cost structures is crucial for investors and analysts alike. Cisco Systems, Inc. and Infosys Limited, two giants in the field, have shown intriguing trends in their cost of revenue over the past decade. From 2014 to 2023, Cisco's cost of revenue fluctuated, peaking in 2023 with a 10% increase from 2014. Meanwhile, Infosys demonstrated a robust growth trajectory, with its cost of revenue more than doubling, reflecting its expanding operations and market reach. Notably, 2024 data for Infosys is missing, indicating potential reporting delays or strategic shifts. These insights not only highlight the companies' operational strategies but also provide a window into their financial health and market positioning. As the tech landscape continues to shift, keeping an eye on these metrics will be essential for stakeholders.
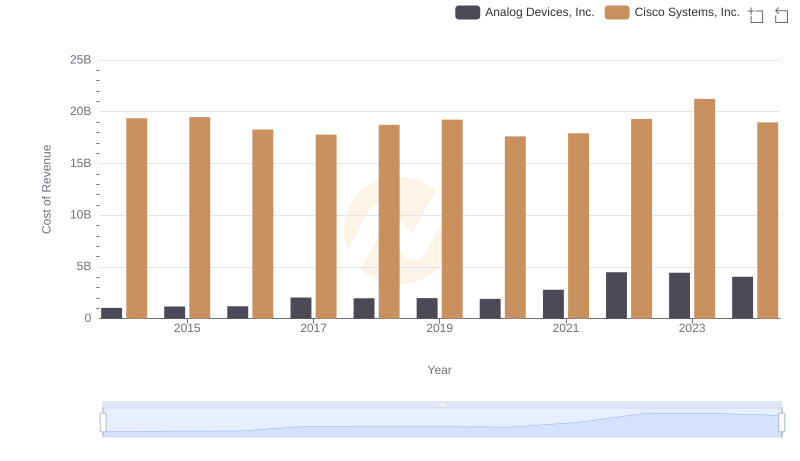
Comparing Cost of Revenue Efficiency: Cisco Systems, Inc. vs Analog Devices, Inc.
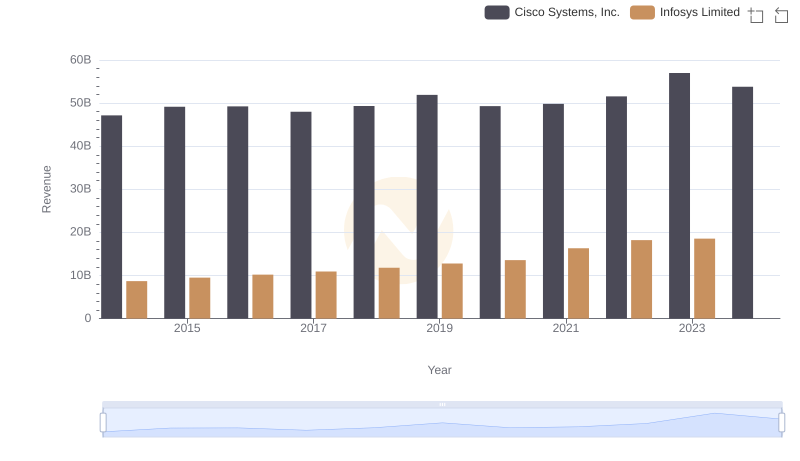
Cisco Systems, Inc. vs Infosys Limited: Annual Revenue Growth Compared
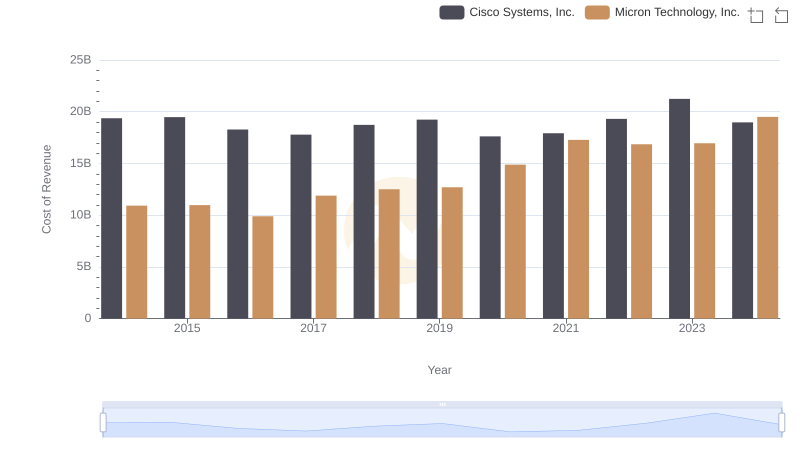
Analyzing Cost of Revenue: Cisco Systems, Inc. and Micron Technology, Inc.
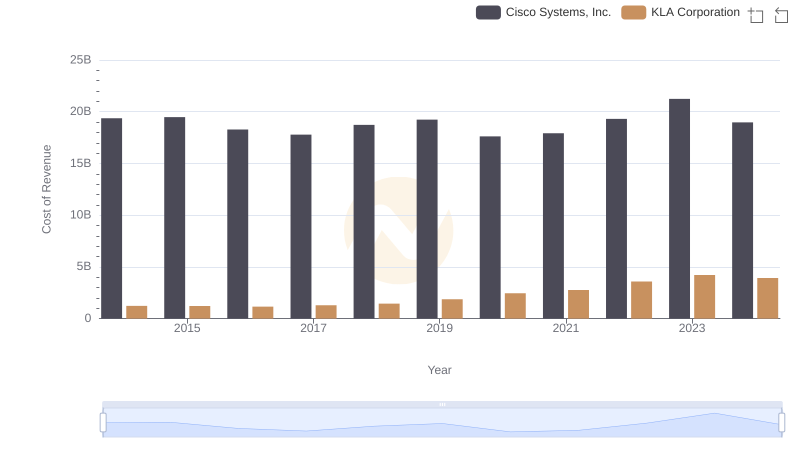
Cisco Systems, Inc. vs KLA Corporation: Efficiency in Cost of Revenue Explored
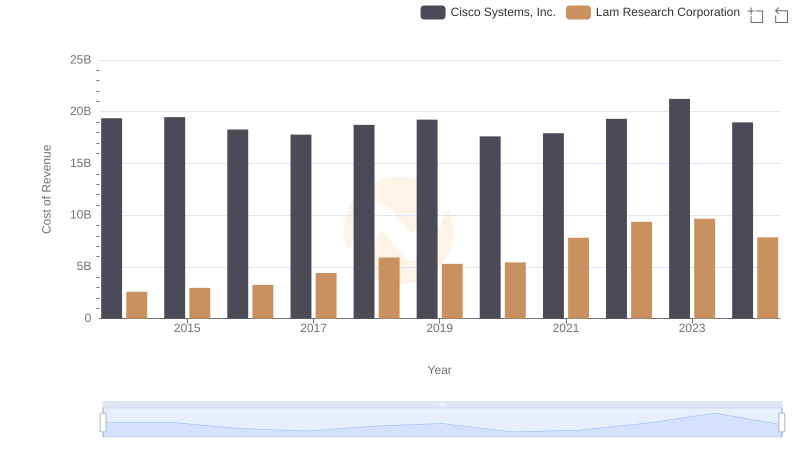
Analyzing Cost of Revenue: Cisco Systems, Inc. and Lam Research Corporation
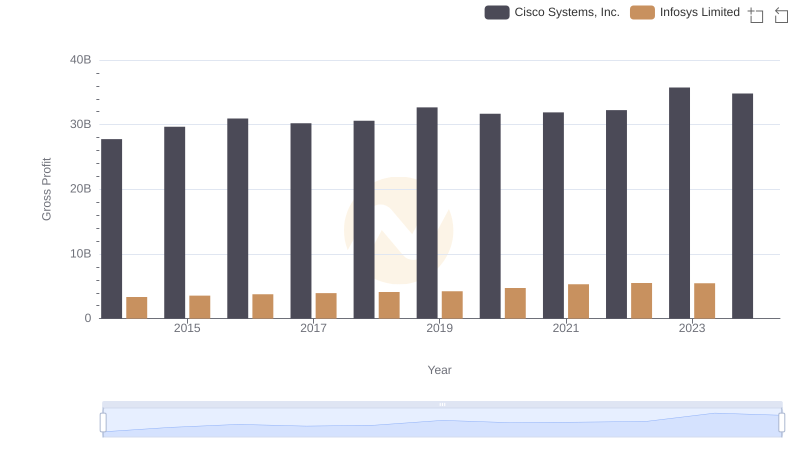
Gross Profit Analysis: Comparing Cisco Systems, Inc. and Infosys Limited
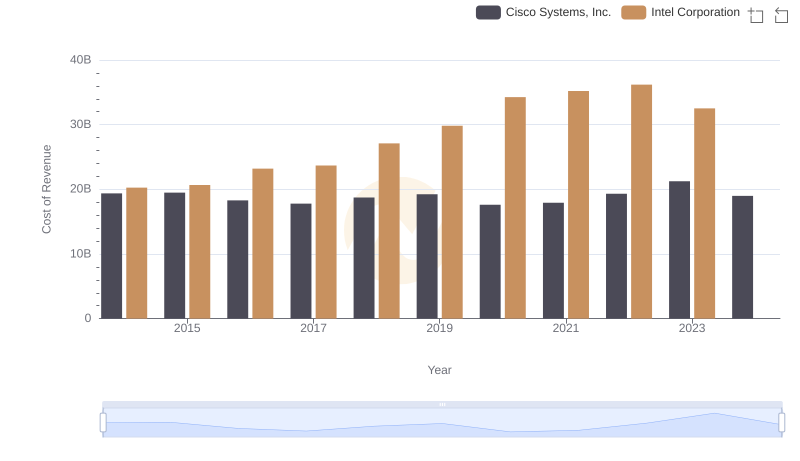
Comparing Cost of Revenue Efficiency: Cisco Systems, Inc. vs Intel Corporation
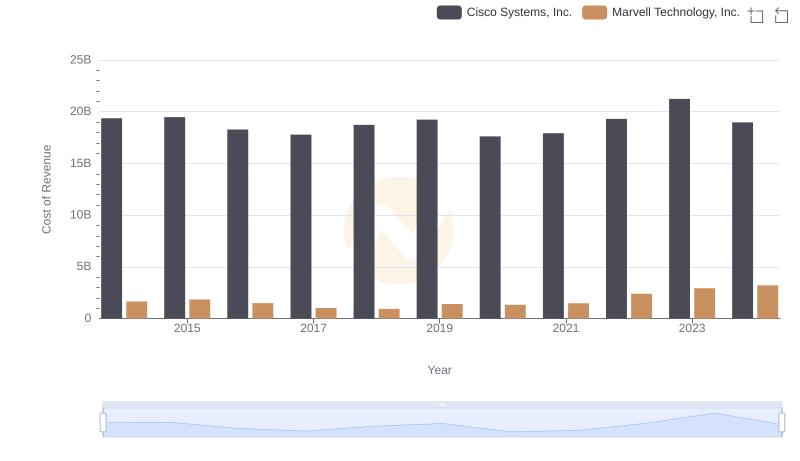
Comparing Cost of Revenue Efficiency: Cisco Systems, Inc. vs Marvell Technology, Inc.
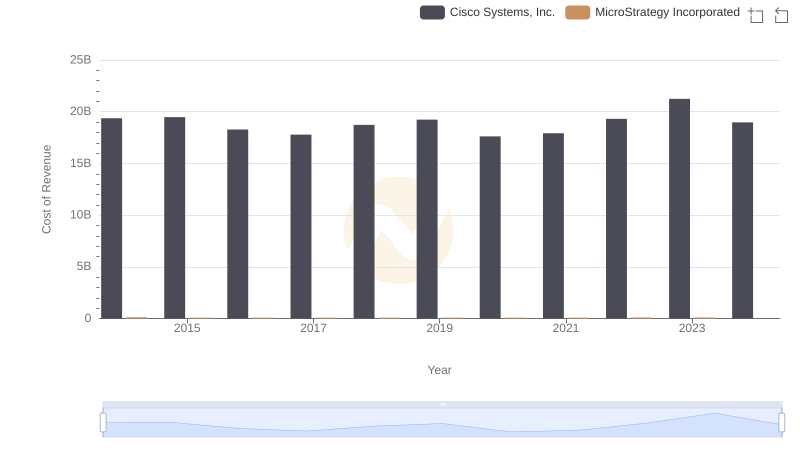
Cost of Revenue: Key Insights for Cisco Systems, Inc. and MicroStrategy Incorporated
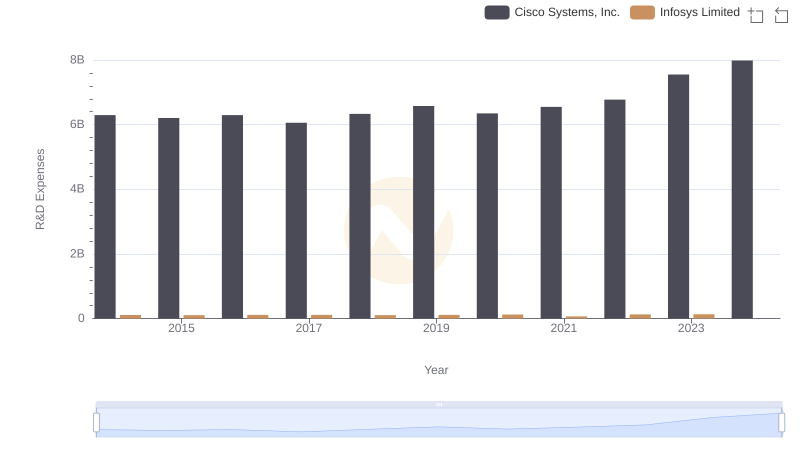
Analyzing R&D Budgets: Cisco Systems, Inc. vs Infosys Limited
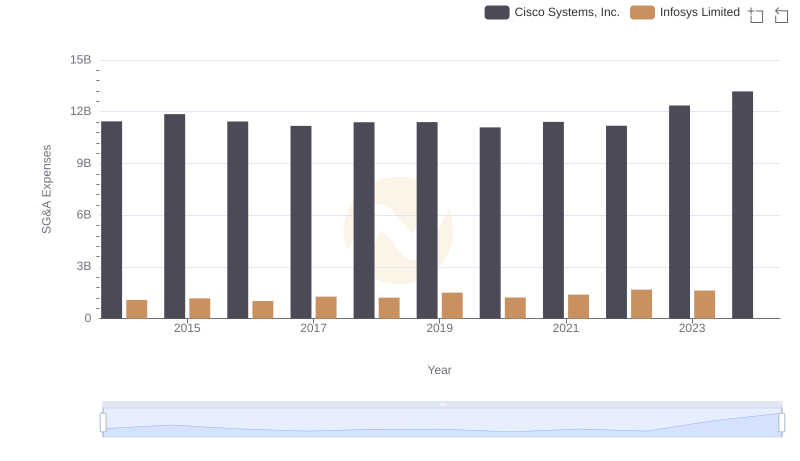
Cisco Systems, Inc. and Infosys Limited: SG&A Spending Patterns Compared
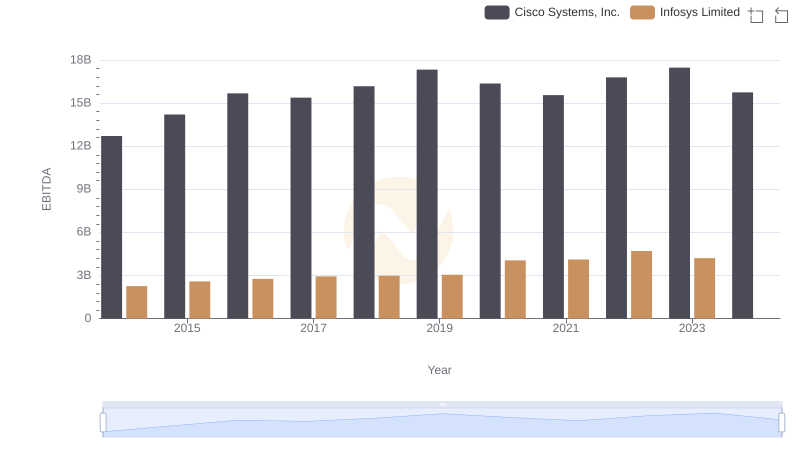
Professional EBITDA Benchmarking: Cisco Systems, Inc. vs Infosys Limited