| __timestamp | Cintas Corporation | Nordson Corporation |
|---|---|---|
| Wednesday, January 1, 2014 | 4551812000 | 1704021000 |
| Thursday, January 1, 2015 | 4476886000 | 1688666000 |
| Friday, January 1, 2016 | 4905458000 | 1808994000 |
| Sunday, January 1, 2017 | 5323381000 | 2066982000 |
| Monday, January 1, 2018 | 6476632000 | 2254668000 |
| Tuesday, January 1, 2019 | 6892303000 | 2194226000 |
| Wednesday, January 1, 2020 | 7085120000 | 2121100000 |
| Friday, January 1, 2021 | 7116340000 | 2362209000 |
| Saturday, January 1, 2022 | 7854459000 | 2590278000 |
| Sunday, January 1, 2023 | 8815769000 | 2628632000 |
| Monday, January 1, 2024 | 9596615000 | 2689921000 |
Unleashing the power of data
In the competitive landscape of industrial services and manufacturing, Cintas Corporation and Nordson Corporation have demonstrated remarkable revenue growth over the past decade. Since 2014, Cintas has seen its annual revenue soar by over 110%, reaching nearly $9.6 billion in 2024. This impressive growth reflects a compound annual growth rate (CAGR) of approximately 8.5%, underscoring Cintas's strategic expansion and market penetration.
Meanwhile, Nordson Corporation, a leader in precision technology, has also experienced steady growth. From 2014 to 2024, Nordson's revenue increased by about 58%, achieving a CAGR of around 4.7%. This growth trajectory highlights Nordson's resilience and adaptability in a rapidly evolving market.
Both companies have navigated economic fluctuations and industry challenges, showcasing their robust business models and commitment to innovation. As we look to the future, these trends suggest continued opportunities for growth and leadership in their respective sectors.
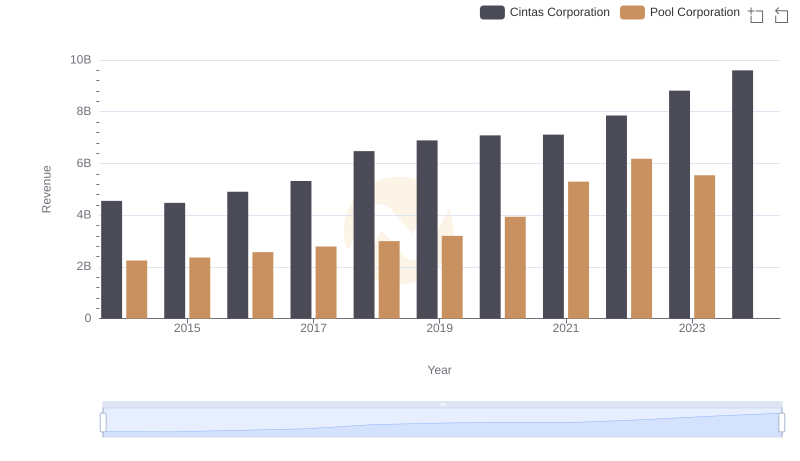
Who Generates More Revenue? Cintas Corporation or Pool Corporation
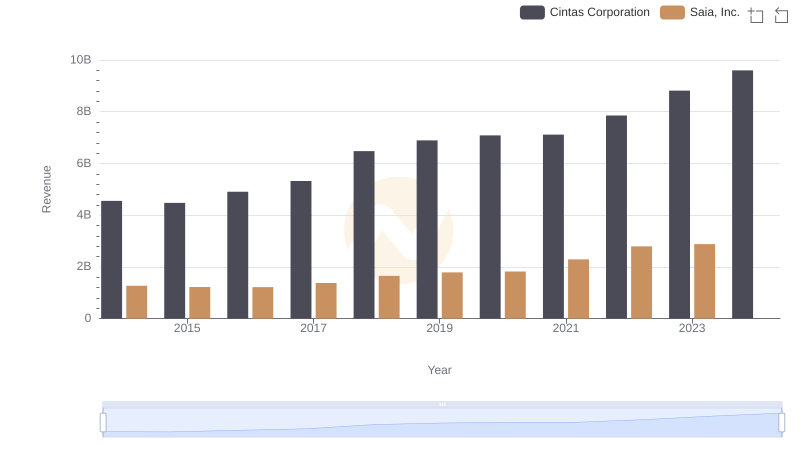
Cintas Corporation vs Saia, Inc.: Examining Key Revenue Metrics
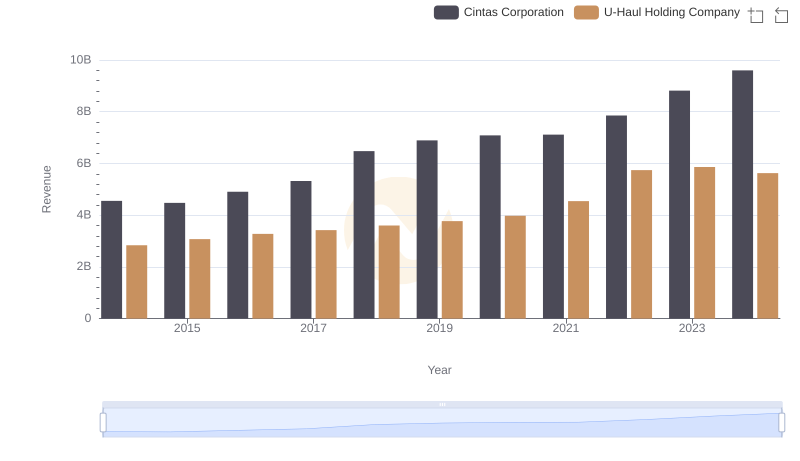
Who Generates More Revenue? Cintas Corporation or U-Haul Holding Company
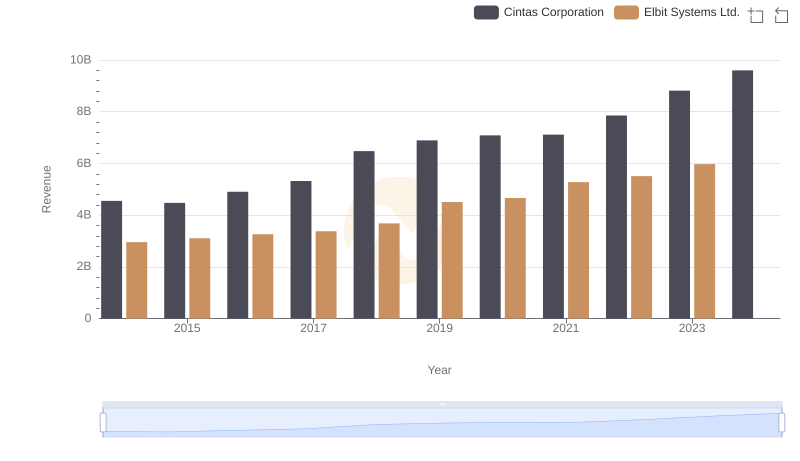
Who Generates More Revenue? Cintas Corporation or Elbit Systems Ltd.
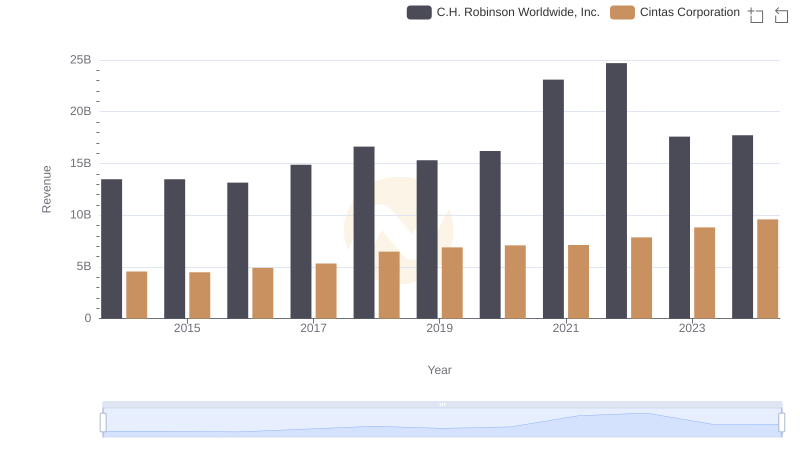
Revenue Showdown: Cintas Corporation vs C.H. Robinson Worldwide, Inc.
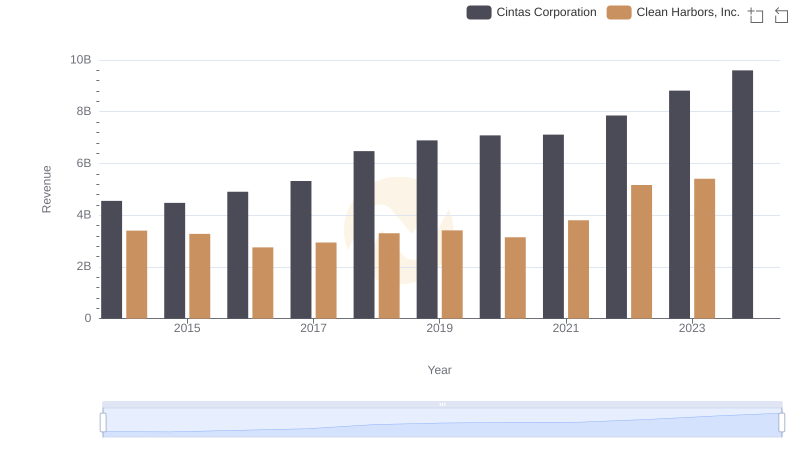
Revenue Insights: Cintas Corporation and Clean Harbors, Inc. Performance Compared
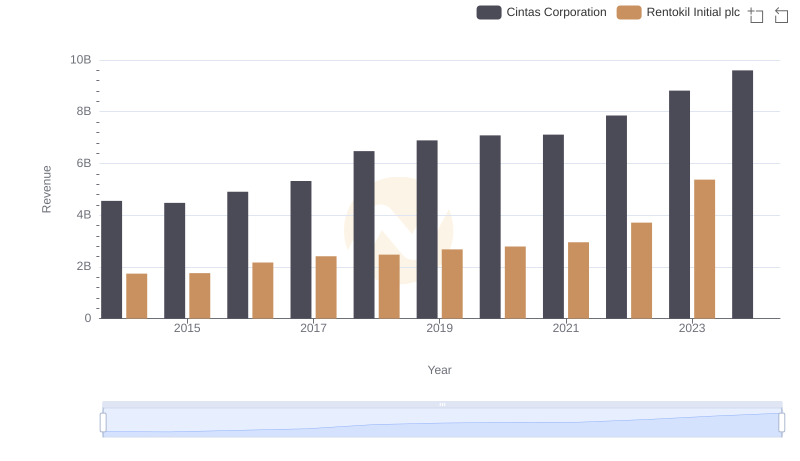
Cintas Corporation vs Rentokil Initial plc: Annual Revenue Growth Compared
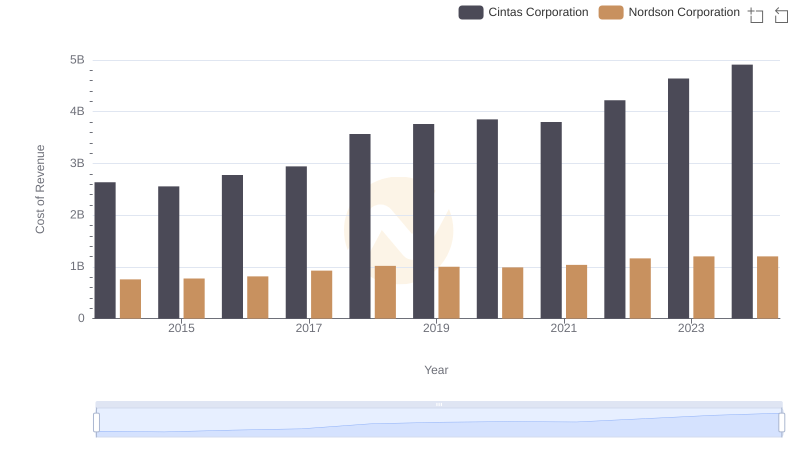
Comparing Cost of Revenue Efficiency: Cintas Corporation vs Nordson Corporation
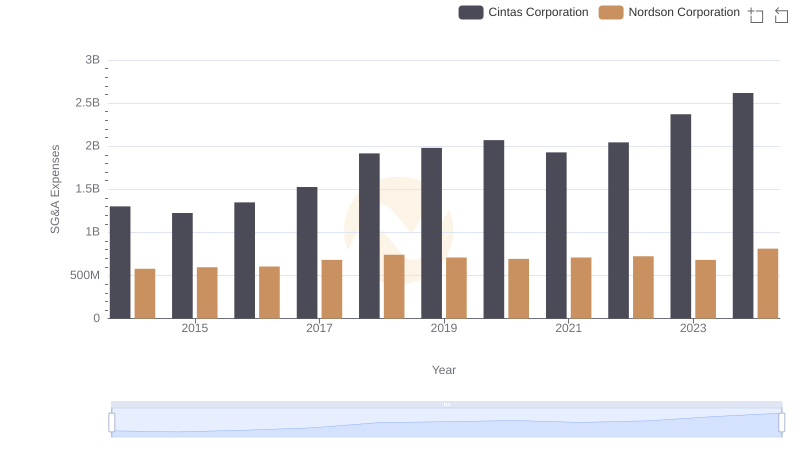
Breaking Down SG&A Expenses: Cintas Corporation vs Nordson Corporation
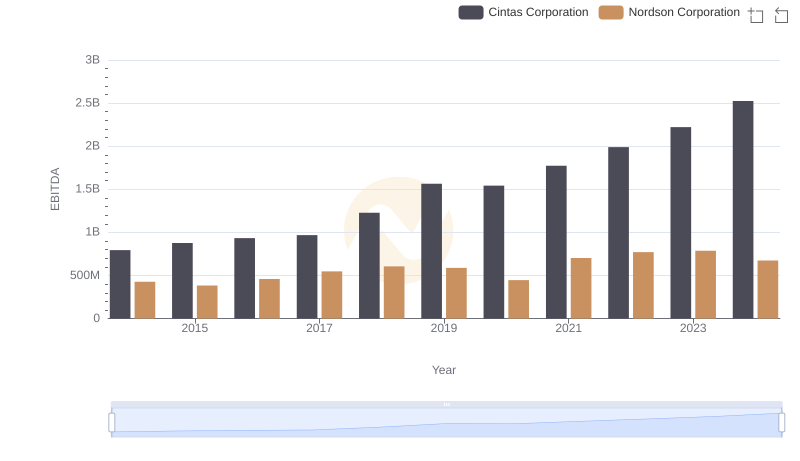
Comparative EBITDA Analysis: Cintas Corporation vs Nordson Corporation