| __timestamp | Graco Inc. | Old Dominion Freight Line, Inc. |
|---|---|---|
| Wednesday, January 1, 2014 | 666736000 | 687488000 |
| Thursday, January 1, 2015 | 684700000 | 757499000 |
| Friday, January 1, 2016 | 708239000 | 744627000 |
| Sunday, January 1, 2017 | 793049000 | 875380000 |
| Monday, January 1, 2018 | 882539000 | 1144243000 |
| Tuesday, January 1, 2019 | 859756000 | 1170216000 |
| Wednesday, January 1, 2020 | 854937000 | 1228598000 |
| Friday, January 1, 2021 | 1033949000 | 1775060000 |
| Saturday, January 1, 2022 | 1057439000 | 2256126000 |
| Sunday, January 1, 2023 | 1161021000 | 2072199000 |
| Monday, January 1, 2024 | 1122461000 |
Unveiling the hidden dimensions of data
In the competitive landscape of American industry, Old Dominion Freight Line, Inc. and Graco Inc. have emerged as leaders in their respective fields. Over the past decade, these companies have demonstrated remarkable growth in gross profit, a key indicator of financial health. From 2014 to 2023, Old Dominion Freight Line, Inc. saw its gross profit soar by approximately 202%, peaking in 2022. Meanwhile, Graco Inc. experienced a steady increase of around 74% during the same period, reaching its highest point in 2023.
This analysis highlights the dynamic nature of these industries and the strategic prowess of these companies.
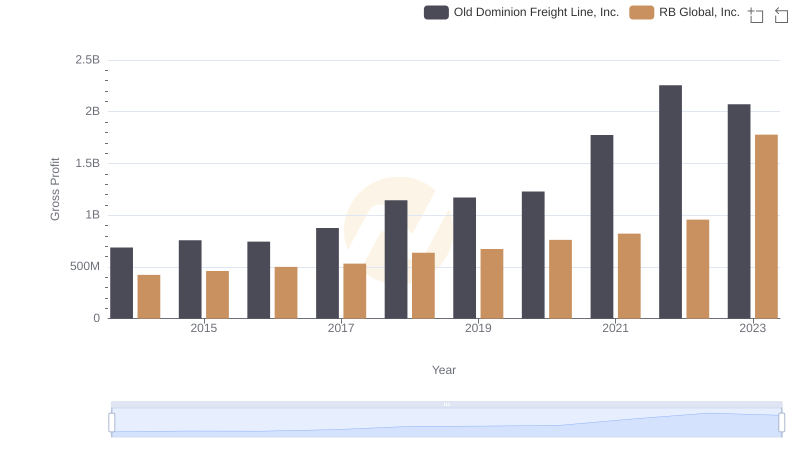
Key Insights on Gross Profit: Old Dominion Freight Line, Inc. vs RB Global, Inc.
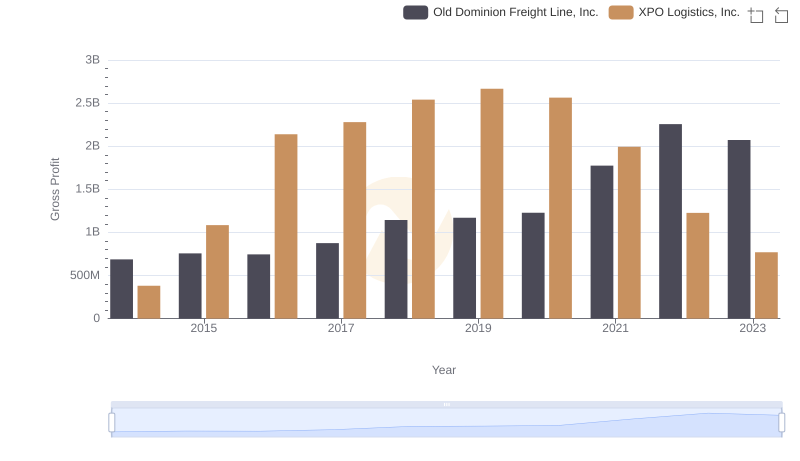
Key Insights on Gross Profit: Old Dominion Freight Line, Inc. vs XPO Logistics, Inc.
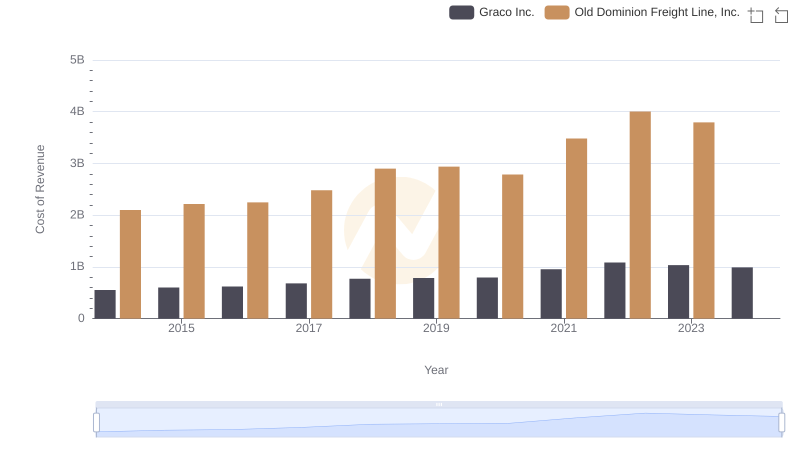
Cost of Revenue Comparison: Old Dominion Freight Line, Inc. vs Graco Inc.
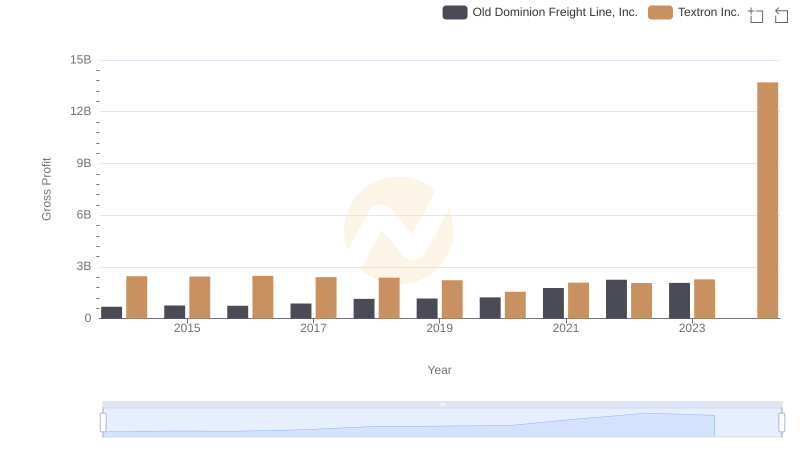
Old Dominion Freight Line, Inc. vs Textron Inc.: A Gross Profit Performance Breakdown
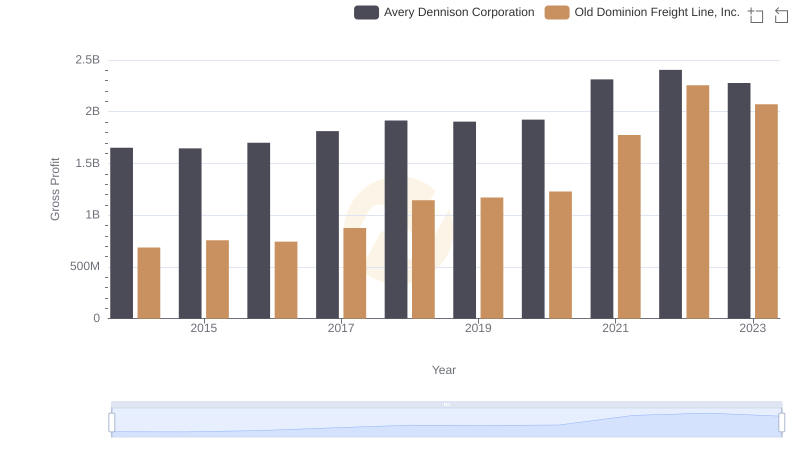
Gross Profit Analysis: Comparing Old Dominion Freight Line, Inc. and Avery Dennison Corporation
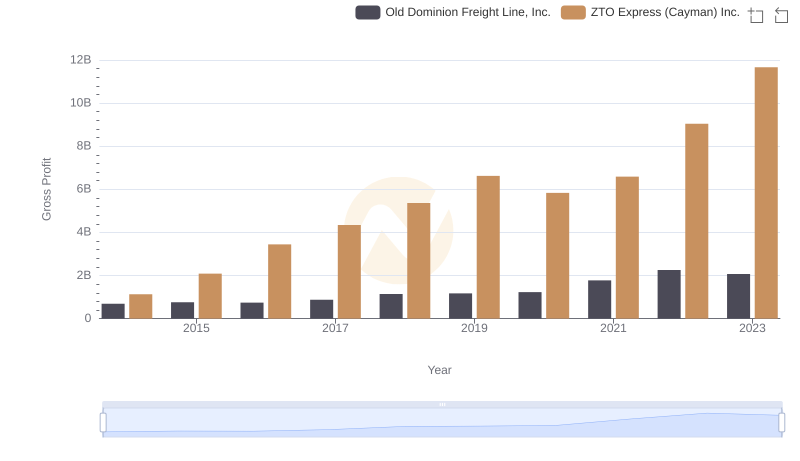
Gross Profit Comparison: Old Dominion Freight Line, Inc. and ZTO Express (Cayman) Inc. Trends
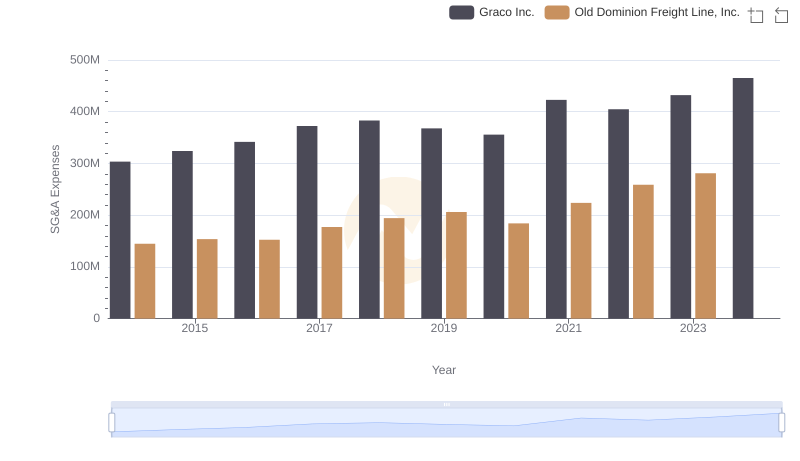
Old Dominion Freight Line, Inc. vs Graco Inc.: SG&A Expense Trends
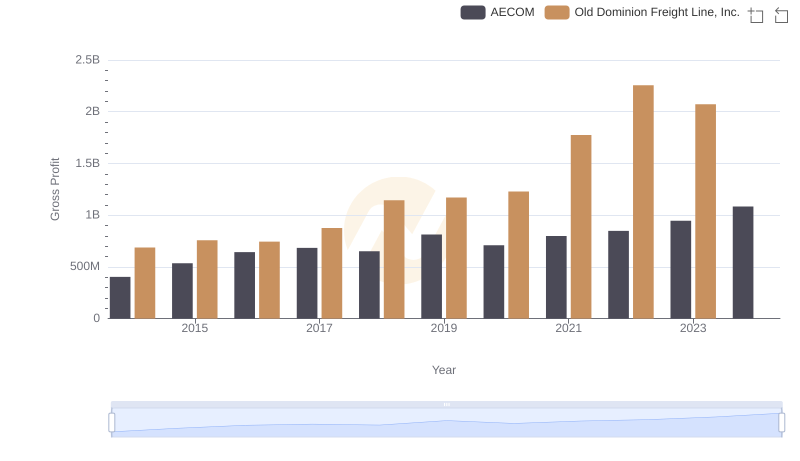
Gross Profit Analysis: Comparing Old Dominion Freight Line, Inc. and AECOM
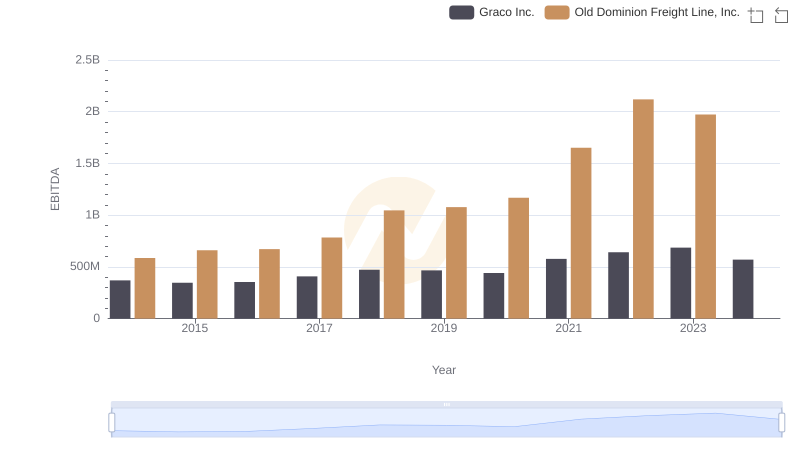
Comparative EBITDA Analysis: Old Dominion Freight Line, Inc. vs Graco Inc.