| __timestamp | Comfort Systems USA, Inc. | Old Dominion Freight Line, Inc. |
|---|---|---|
| Wednesday, January 1, 2014 | 63455000 | 585590000 |
| Thursday, January 1, 2015 | 112580000 | 660570000 |
| Friday, January 1, 2016 | 126974000 | 671786000 |
| Sunday, January 1, 2017 | 137151000 | 783749000 |
| Monday, January 1, 2018 | 191982000 | 1046059000 |
| Tuesday, January 1, 2019 | 229518000 | 1078007000 |
| Wednesday, January 1, 2020 | 276904000 | 1168149000 |
| Friday, January 1, 2021 | 282506000 | 1651501000 |
| Saturday, January 1, 2022 | 352446000 | 2118962000 |
| Sunday, January 1, 2023 | 497652000 | 1972689000 |
Igniting the spark of knowledge
In the competitive landscape of the logistics and construction industries, Old Dominion Freight Line, Inc. and Comfort Systems USA, Inc. have emerged as formidable players. Over the past decade, from 2014 to 2023, these companies have demonstrated remarkable growth in their EBITDA, a key indicator of financial health and operational efficiency.
Old Dominion Freight Line, Inc. has shown a staggering 237% increase in EBITDA, soaring from approximately $586 million in 2014 to nearly $1.97 billion in 2023. This growth underscores their strategic prowess in the freight industry, capitalizing on increased demand and operational efficiencies.
Comfort Systems USA, Inc., while smaller in scale, has also experienced impressive growth. Their EBITDA has increased by 684%, from around $63 million in 2014 to nearly $498 million in 2023, reflecting their stronghold in the HVAC sector.
These trends highlight the dynamic nature of these industries and the strategic maneuvers of these companies to maintain their competitive edge.
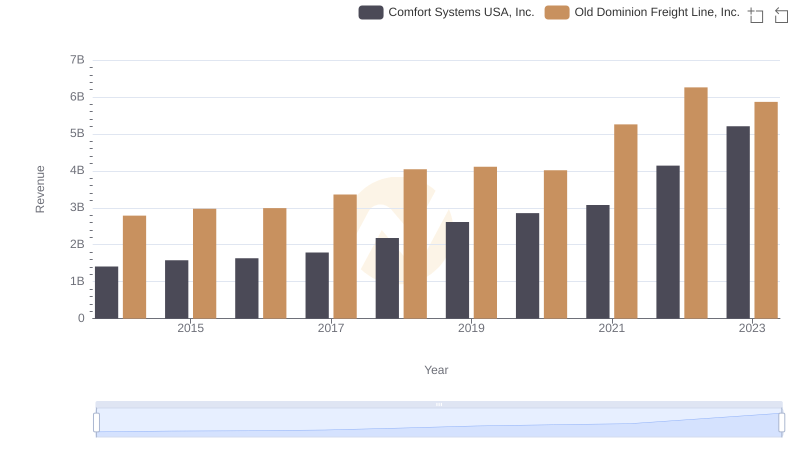
Breaking Down Revenue Trends: Old Dominion Freight Line, Inc. vs Comfort Systems USA, Inc.
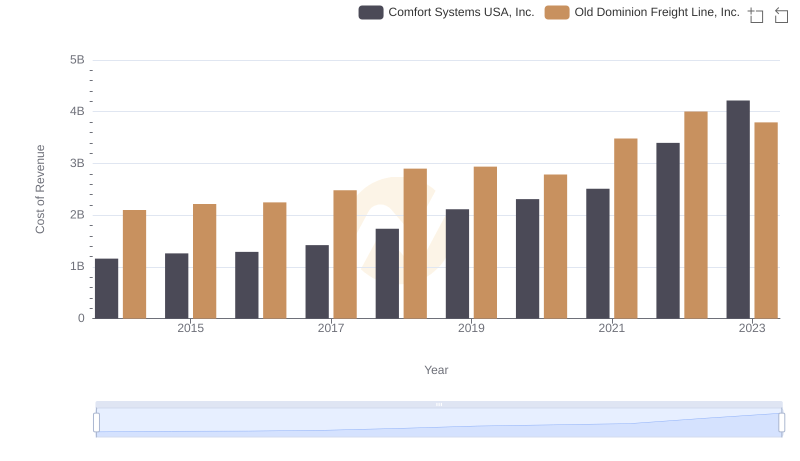
Analyzing Cost of Revenue: Old Dominion Freight Line, Inc. and Comfort Systems USA, Inc.
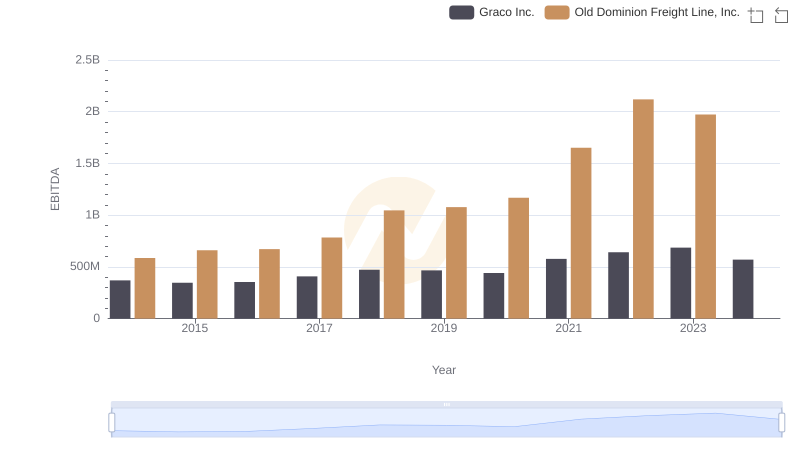
Comparative EBITDA Analysis: Old Dominion Freight Line, Inc. vs Graco Inc.
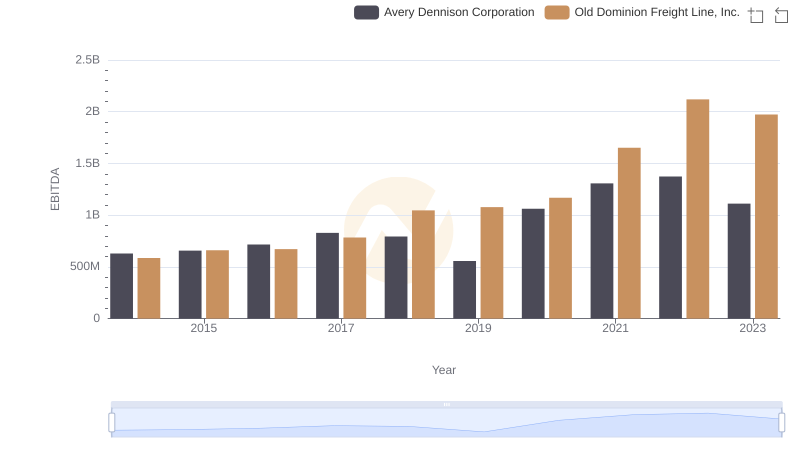
A Professional Review of EBITDA: Old Dominion Freight Line, Inc. Compared to Avery Dennison Corporation
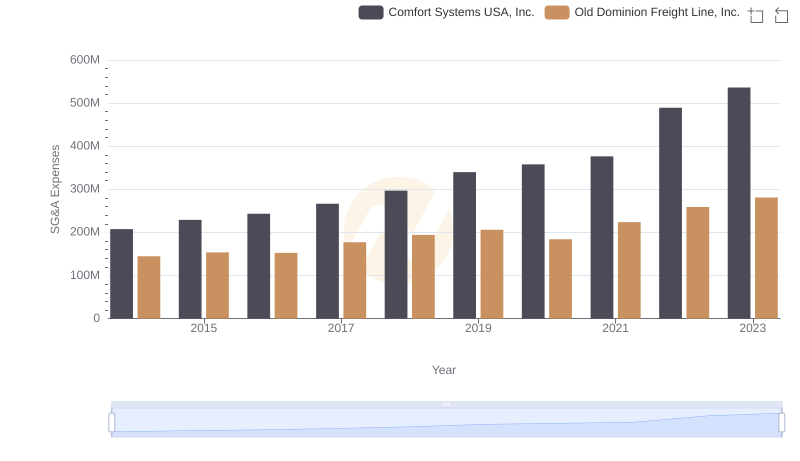
Comparing SG&A Expenses: Old Dominion Freight Line, Inc. vs Comfort Systems USA, Inc. Trends and Insights
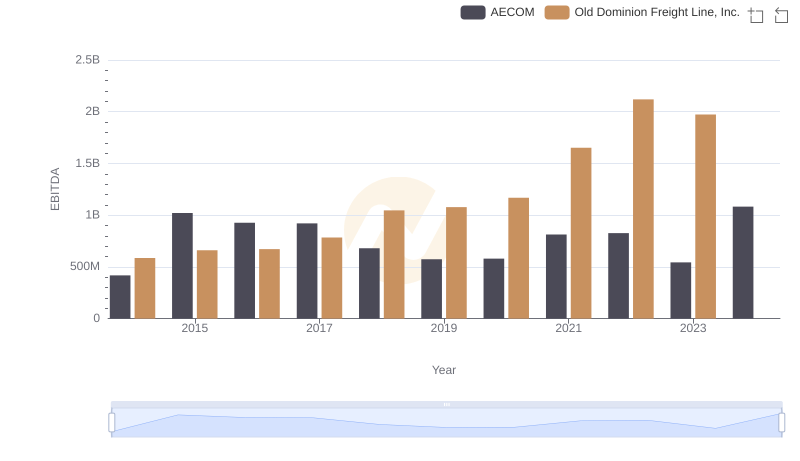
Old Dominion Freight Line, Inc. and AECOM: A Detailed Examination of EBITDA Performance
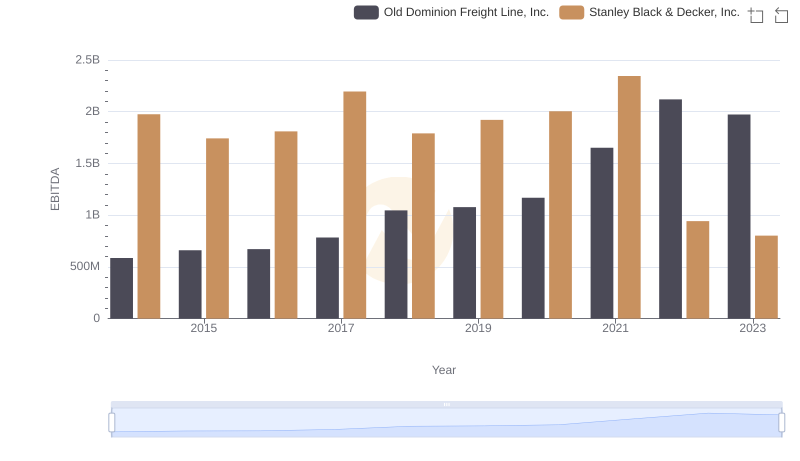
A Professional Review of EBITDA: Old Dominion Freight Line, Inc. Compared to Stanley Black & Decker, Inc.
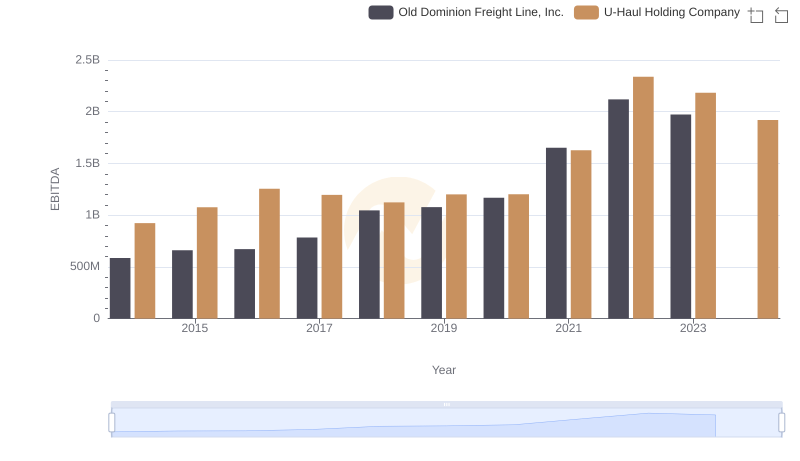
A Side-by-Side Analysis of EBITDA: Old Dominion Freight Line, Inc. and U-Haul Holding Company
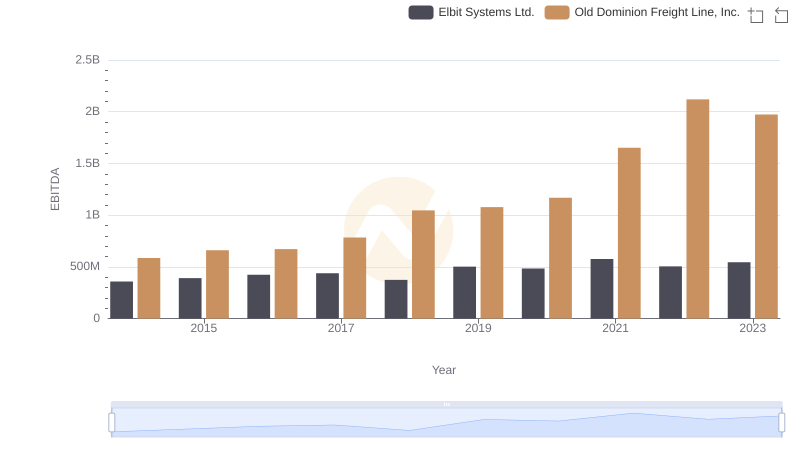
Comparative EBITDA Analysis: Old Dominion Freight Line, Inc. vs Elbit Systems Ltd.