| __timestamp | International Business Machines Corporation | Trimble Inc. |
|---|---|---|
| Wednesday, January 1, 2014 | 46407000000 | 1290844000 |
| Thursday, January 1, 2015 | 40684000000 | 1202200000 |
| Friday, January 1, 2016 | 38516000000 | 1238000000 |
| Sunday, January 1, 2017 | 36943000000 | 1392600000 |
| Monday, January 1, 2018 | 36936000000 | 1681000000 |
| Tuesday, January 1, 2019 | 31533000000 | 1780900000 |
| Wednesday, January 1, 2020 | 30865000000 | 1754900000 |
| Friday, January 1, 2021 | 31486000000 | 2034700000 |
| Saturday, January 1, 2022 | 32687000000 | 2105600000 |
| Sunday, January 1, 2023 | 34300000000 | 2229200000 |
| Monday, January 1, 2024 | 35551000000 |
Data in motion
In the ever-evolving landscape of technology and innovation, the financial performance of industry giants like International Business Machines Corporation (IBM) and Trimble Inc. offers a fascinating glimpse into their strategic maneuvers. Over the past decade, IBM's gross profit has seen a notable decline of approximately 26%, from its peak in 2014 to 2023. This trend reflects the company's ongoing transformation and adaptation to new market demands. Meanwhile, Trimble Inc., a leader in geospatial solutions, has demonstrated a steady growth trajectory, with its gross profit increasing by about 73% over the same period. This growth underscores Trimble's successful expansion and innovation in its niche markets. The data for 2024 remains incomplete, highlighting the dynamic nature of financial forecasting. As these companies continue to navigate the complexities of the global market, their financial trends offer valuable insights into their strategic directions and market positions.
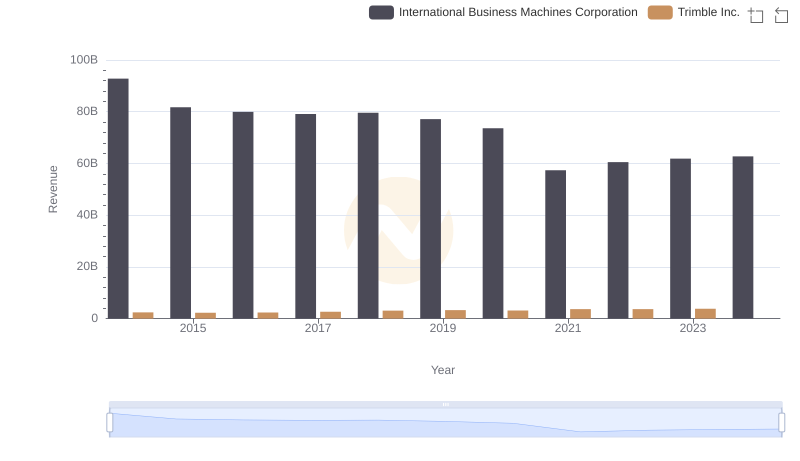
International Business Machines Corporation or Trimble Inc.: Who Leads in Yearly Revenue?
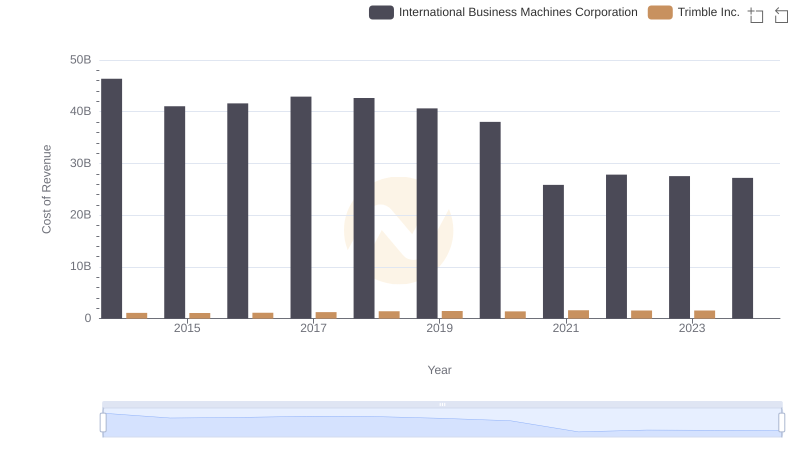
International Business Machines Corporation vs Trimble Inc.: Efficiency in Cost of Revenue Explored
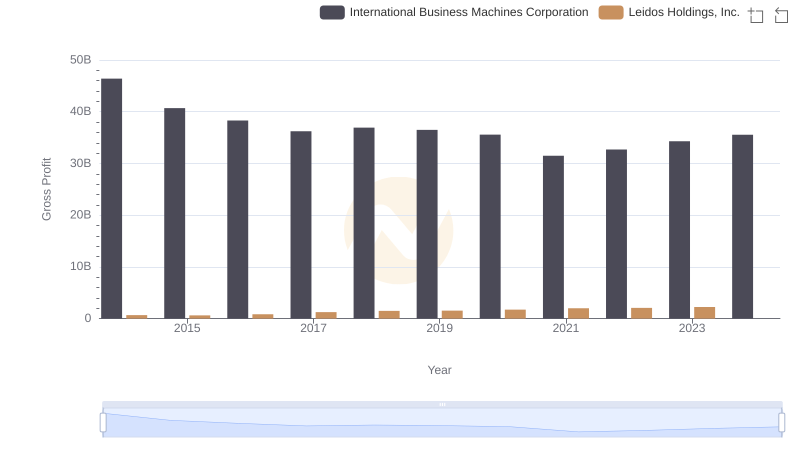
Gross Profit Analysis: Comparing International Business Machines Corporation and Leidos Holdings, Inc.
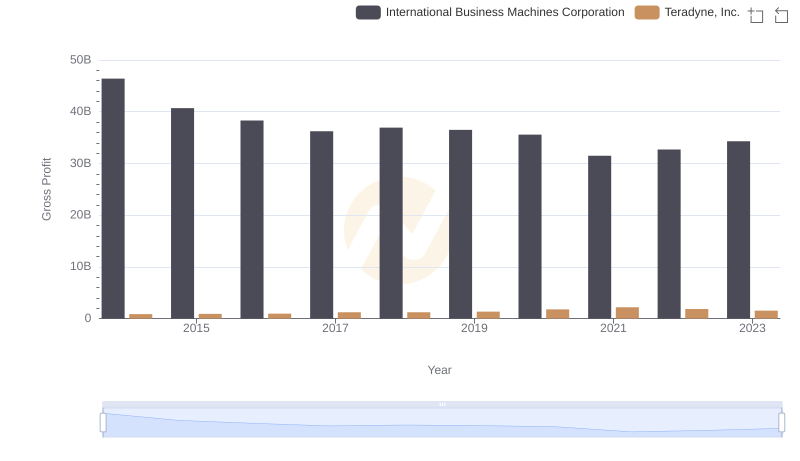
Key Insights on Gross Profit: International Business Machines Corporation vs Teradyne, Inc.
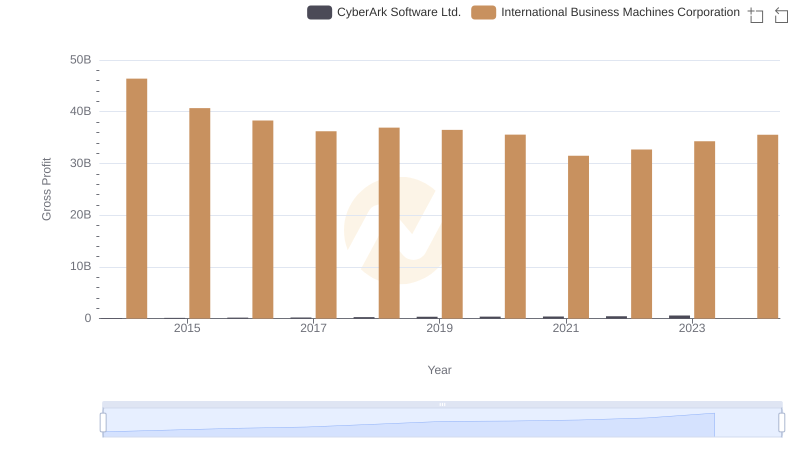
Who Generates Higher Gross Profit? International Business Machines Corporation or CyberArk Software Ltd.
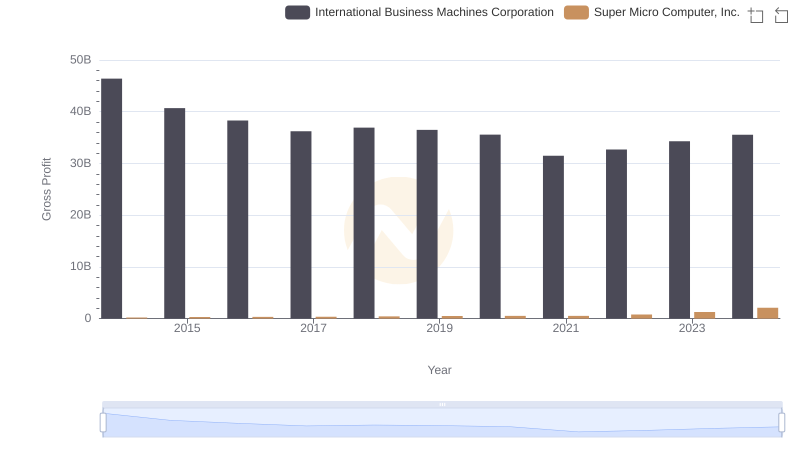
International Business Machines Corporation and Super Micro Computer, Inc.: A Detailed Gross Profit Analysis
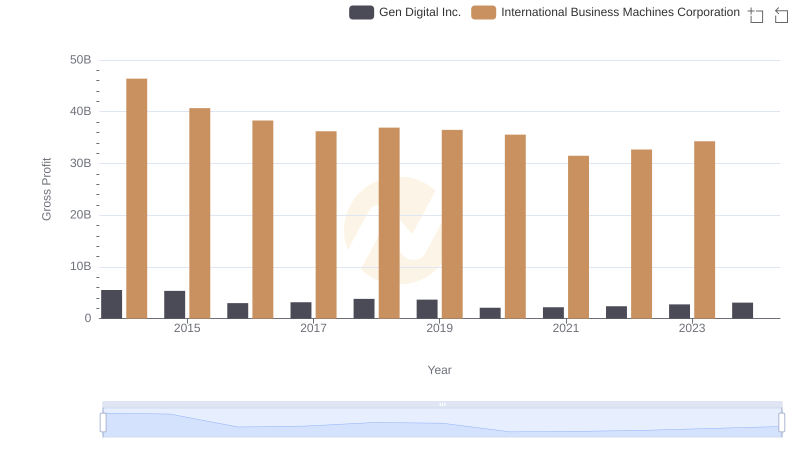
Gross Profit Analysis: Comparing International Business Machines Corporation and Gen Digital Inc.

Gross Profit Analysis: Comparing International Business Machines Corporation and Nutanix, Inc.
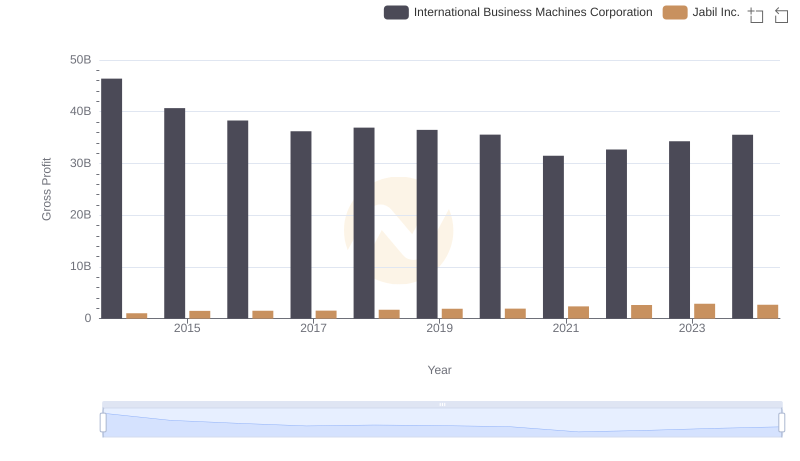
International Business Machines Corporation and Jabil Inc.: A Detailed Gross Profit Analysis
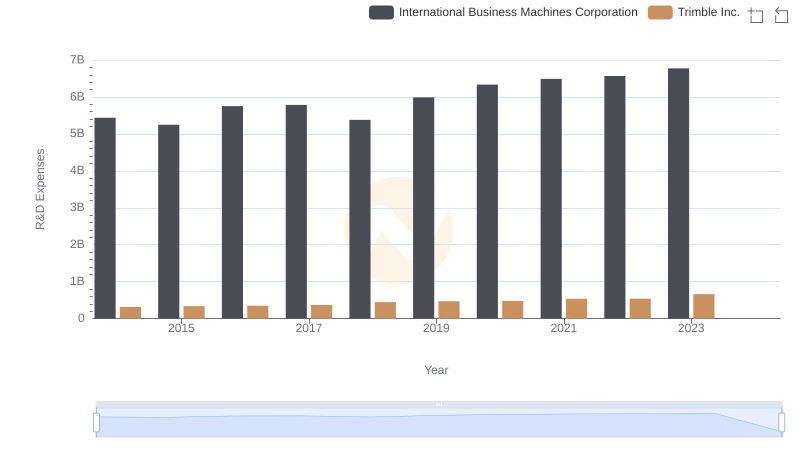
Analyzing R&D Budgets: International Business Machines Corporation vs Trimble Inc.

Breaking Down SG&A Expenses: International Business Machines Corporation vs Trimble Inc.
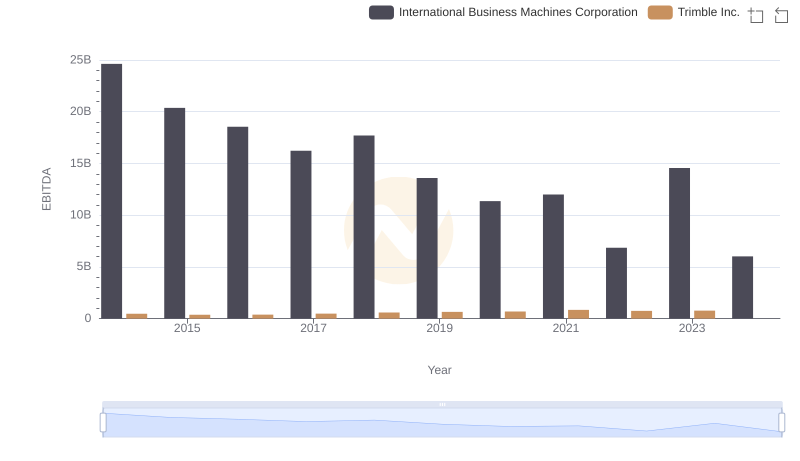
Comparative EBITDA Analysis: International Business Machines Corporation vs Trimble Inc.