| __timestamp | International Business Machines Corporation | Trimble Inc. |
|---|---|---|
| Wednesday, January 1, 2014 | 22472000000 | 634689000 |
| Thursday, January 1, 2015 | 19894000000 | 629900000 |
| Friday, January 1, 2016 | 20279000000 | 633600000 |
| Sunday, January 1, 2017 | 19680000000 | 706500000 |
| Monday, January 1, 2018 | 19366000000 | 829600000 |
| Tuesday, January 1, 2019 | 18724000000 | 834800000 |
| Wednesday, January 1, 2020 | 20561000000 | 767900000 |
| Friday, January 1, 2021 | 18745000000 | 875900000 |
| Saturday, January 1, 2022 | 17483000000 | 975800000 |
| Sunday, January 1, 2023 | 17997000000 | 1070500000 |
| Monday, January 1, 2024 | 29536000000 |
Unlocking the unknown
In the ever-evolving landscape of technology, understanding the financial strategies of industry giants like International Business Machines Corporation (IBM) and Trimble Inc. offers valuable insights. Over the past decade, IBM's Selling, General, and Administrative (SG&A) expenses have shown a fluctuating trend, peaking in 2024 with a 42% increase from 2023. This suggests a strategic shift or investment in operational efficiency. In contrast, Trimble Inc. has maintained a more stable SG&A expense pattern, with a notable 69% increase from 2014 to 2023, reflecting its steady growth and market adaptation.
The data highlights IBM's significant financial maneuvers, possibly indicating aggressive market positioning or restructuring efforts. Meanwhile, Trimble's consistent expense management underscores its focus on sustainable growth. This comparative analysis not only sheds light on the financial health of these companies but also provides a glimpse into their strategic priorities in a competitive market.
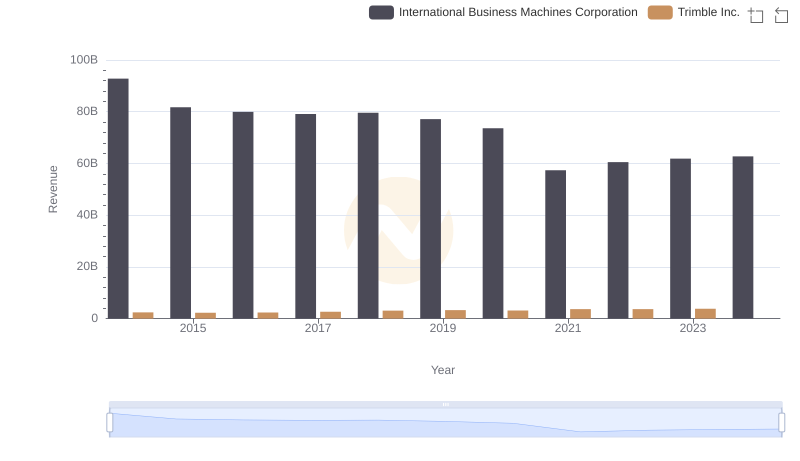
International Business Machines Corporation or Trimble Inc.: Who Leads in Yearly Revenue?
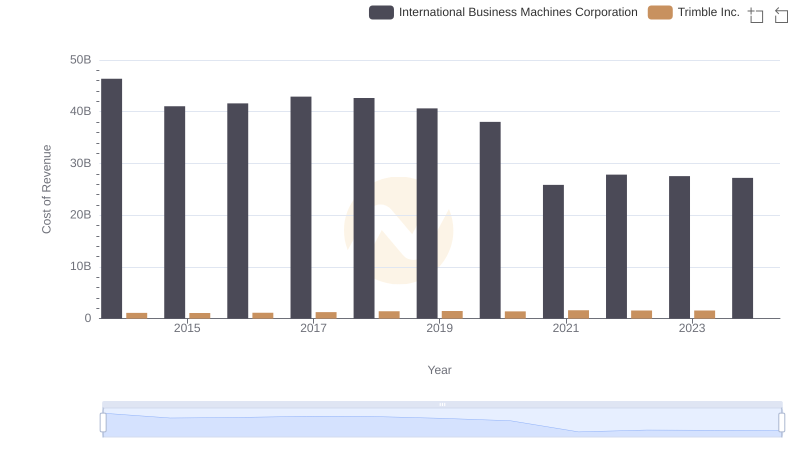
International Business Machines Corporation vs Trimble Inc.: Efficiency in Cost of Revenue Explored
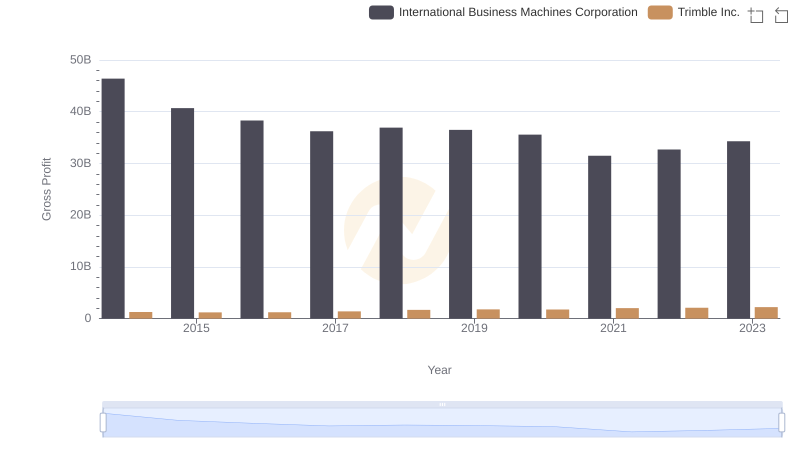
Gross Profit Trends Compared: International Business Machines Corporation vs Trimble Inc.
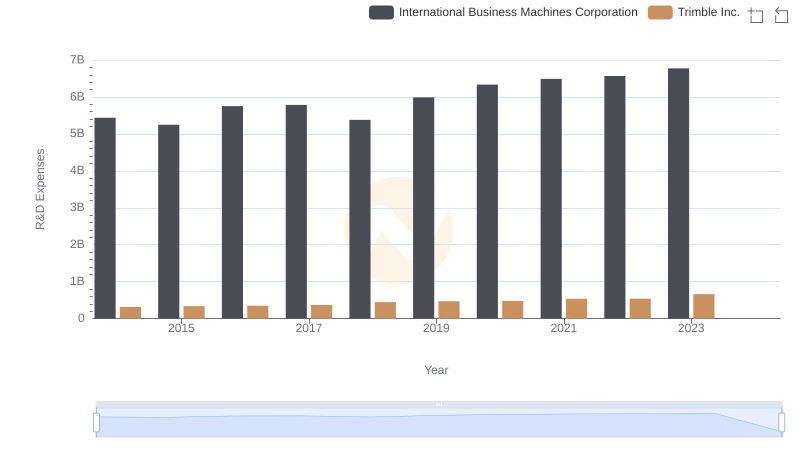
Analyzing R&D Budgets: International Business Machines Corporation vs Trimble Inc.
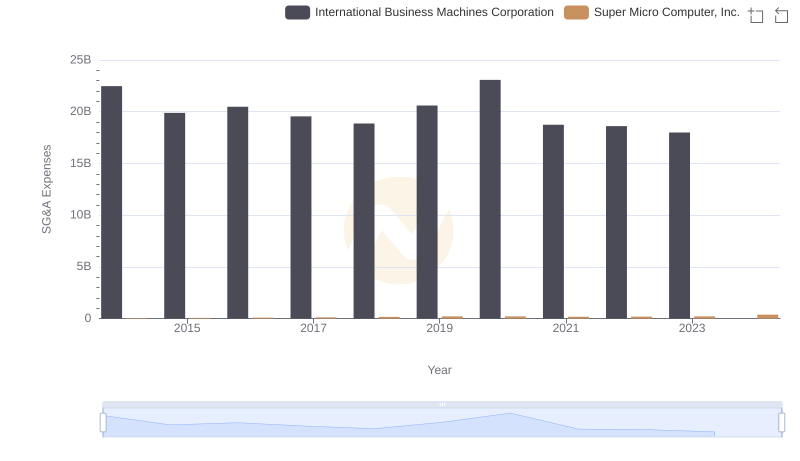
Selling, General, and Administrative Costs: International Business Machines Corporation vs Super Micro Computer, Inc.
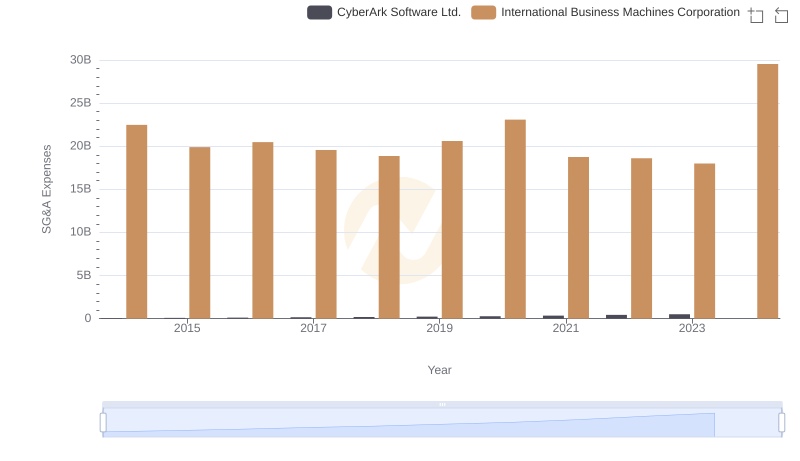
International Business Machines Corporation or CyberArk Software Ltd.: Who Manages SG&A Costs Better?
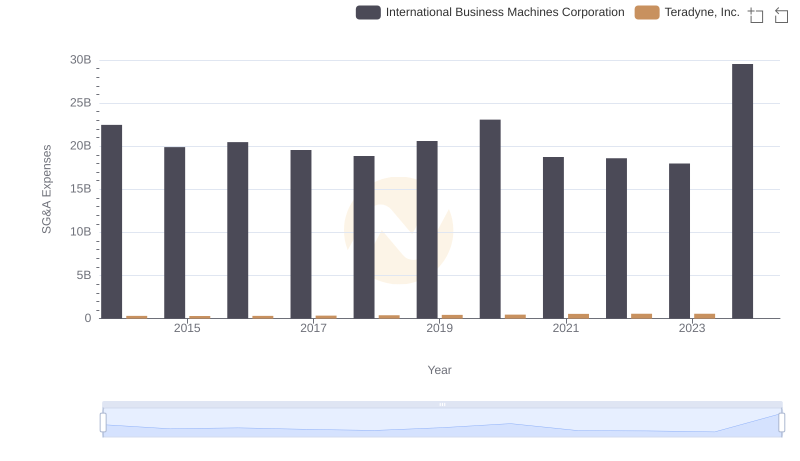
Selling, General, and Administrative Costs: International Business Machines Corporation vs Teradyne, Inc.
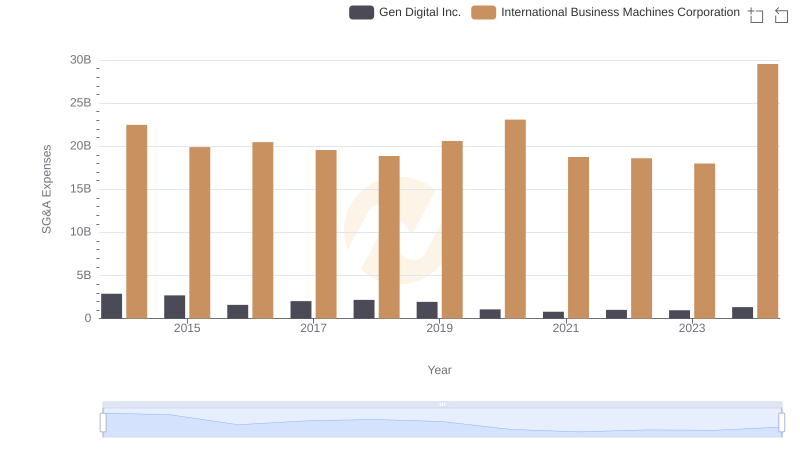
Selling, General, and Administrative Costs: International Business Machines Corporation vs Gen Digital Inc.
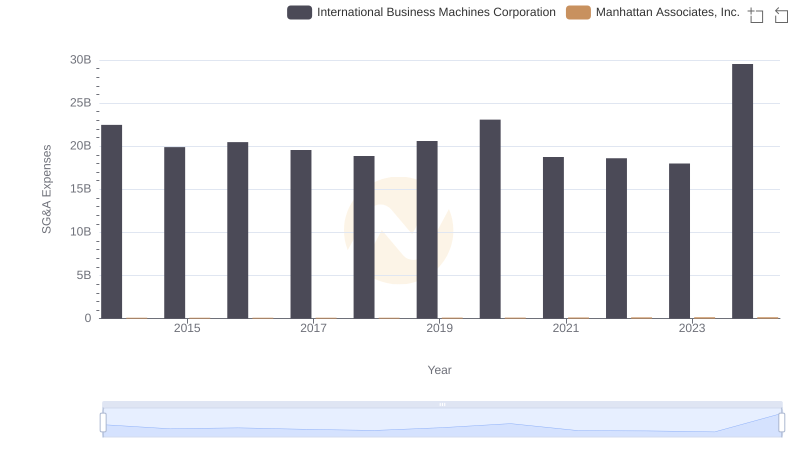
Selling, General, and Administrative Costs: International Business Machines Corporation vs Manhattan Associates, Inc.
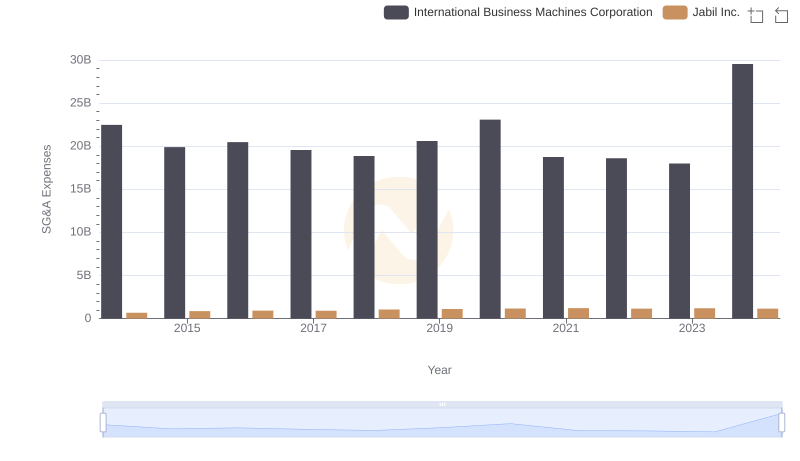
Selling, General, and Administrative Costs: International Business Machines Corporation vs Jabil Inc.
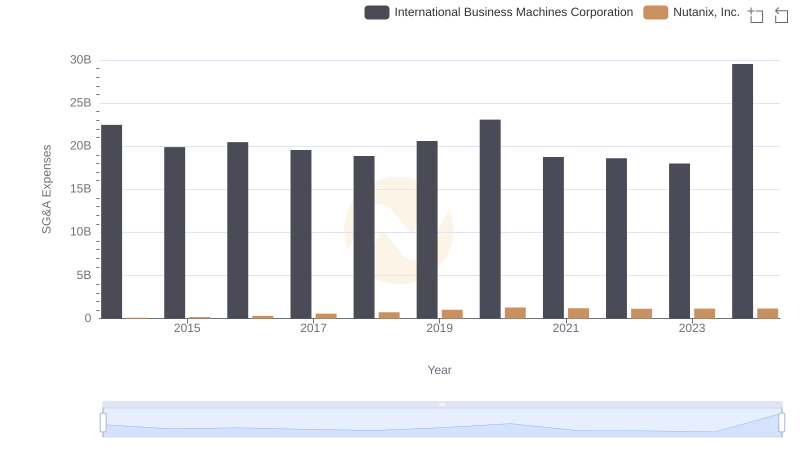
International Business Machines Corporation and Nutanix, Inc.: SG&A Spending Patterns Compared
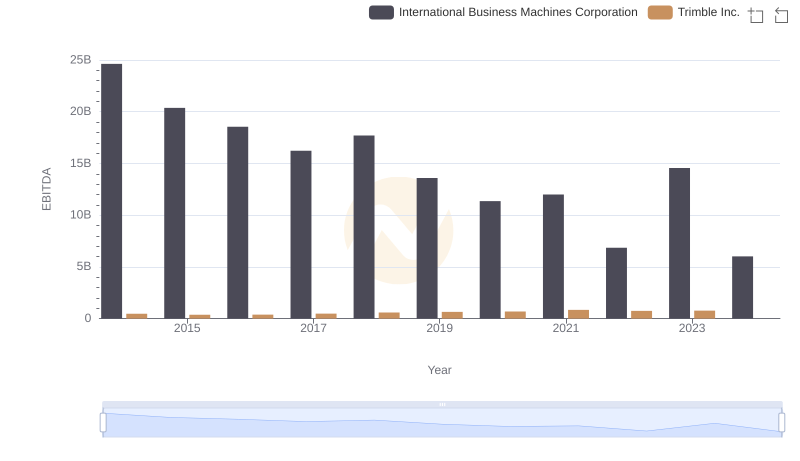
Comparative EBITDA Analysis: International Business Machines Corporation vs Trimble Inc.