| __timestamp | Cintas Corporation | Textron Inc. |
|---|---|---|
| Wednesday, January 1, 2014 | 4551812000 | 13878000000 |
| Thursday, January 1, 2015 | 4476886000 | 13423000000 |
| Friday, January 1, 2016 | 4905458000 | 13788000000 |
| Sunday, January 1, 2017 | 5323381000 | 14198000000 |
| Monday, January 1, 2018 | 6476632000 | 13972000000 |
| Tuesday, January 1, 2019 | 6892303000 | 13630000000 |
| Wednesday, January 1, 2020 | 7085120000 | 11651000000 |
| Friday, January 1, 2021 | 7116340000 | 12382000000 |
| Saturday, January 1, 2022 | 7854459000 | 12869000000 |
| Sunday, January 1, 2023 | 8815769000 | 13683000000 |
| Monday, January 1, 2024 | 9596615000 | 13702000000 |
Unlocking the unknown
In the ever-evolving landscape of American industry, Cintas Corporation and Textron Inc. stand as titans in their respective fields. Over the past decade, these companies have showcased contrasting trajectories in revenue growth. From 2014 to 2024, Cintas Corporation has experienced a remarkable revenue surge of approximately 111%, reflecting its robust expansion strategy and market adaptability. In contrast, Textron Inc. has maintained a more stable revenue pattern, with a modest increase of around 1.5% over the same period.
This comparison highlights the dynamic nature of business growth and the diverse strategies employed by industry leaders to navigate economic challenges.
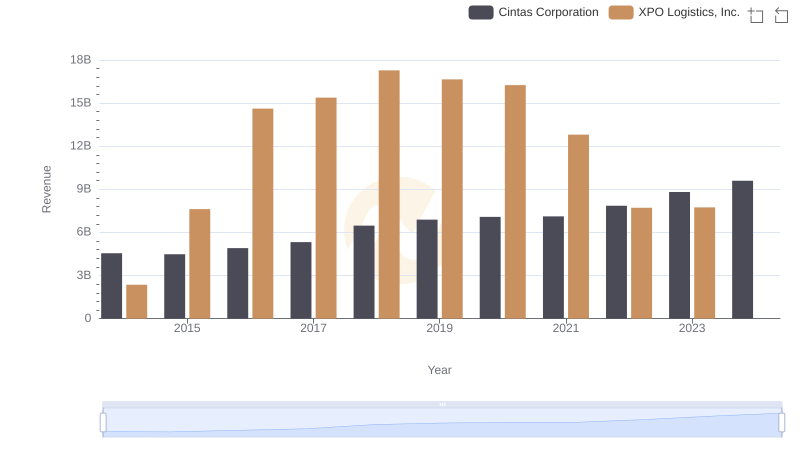
Breaking Down Revenue Trends: Cintas Corporation vs XPO Logistics, Inc.
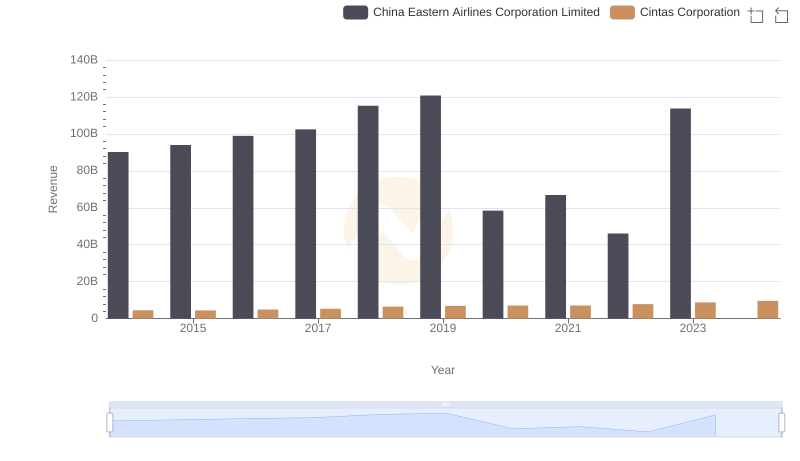
Annual Revenue Comparison: Cintas Corporation vs China Eastern Airlines Corporation Limited
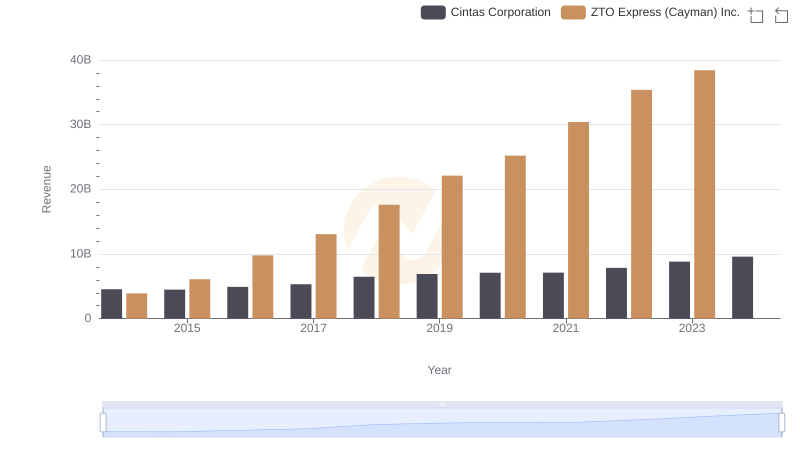
Annual Revenue Comparison: Cintas Corporation vs ZTO Express (Cayman) Inc.
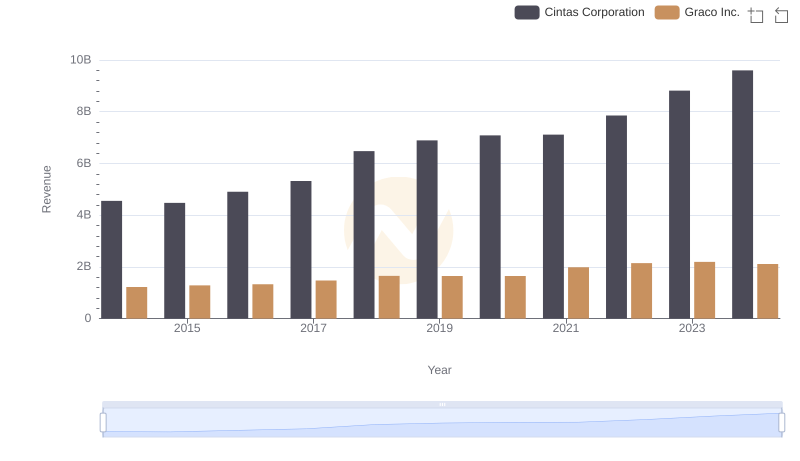
Cintas Corporation and Graco Inc.: A Comprehensive Revenue Analysis
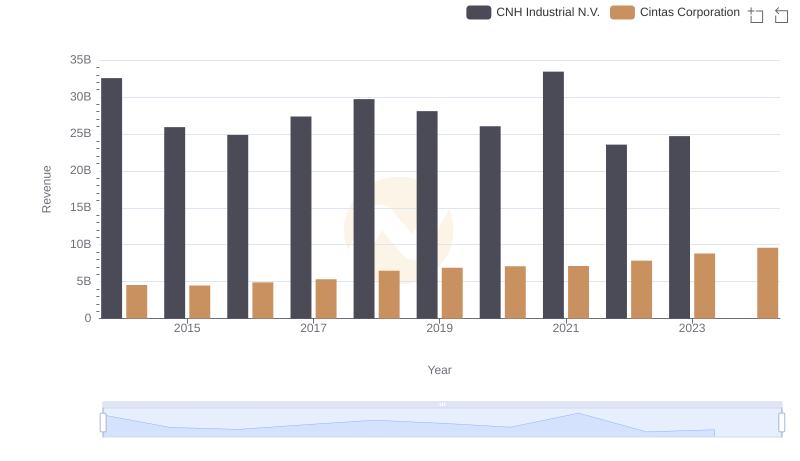
Cintas Corporation and CNH Industrial N.V.: A Comprehensive Revenue Analysis
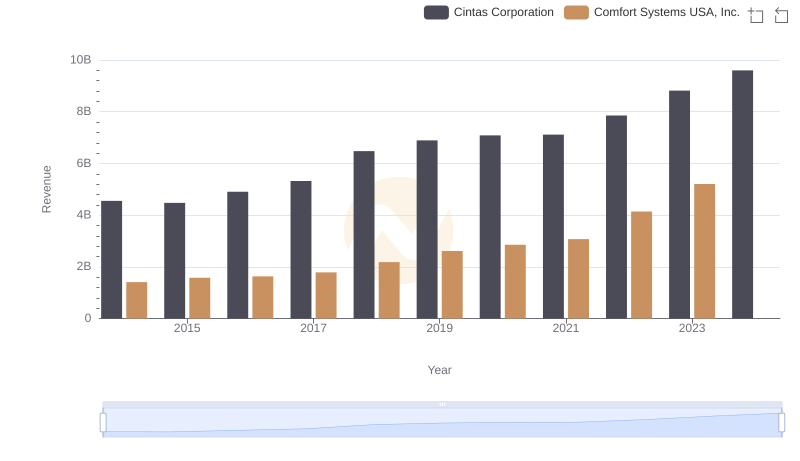
Cintas Corporation and Comfort Systems USA, Inc.: A Comprehensive Revenue Analysis
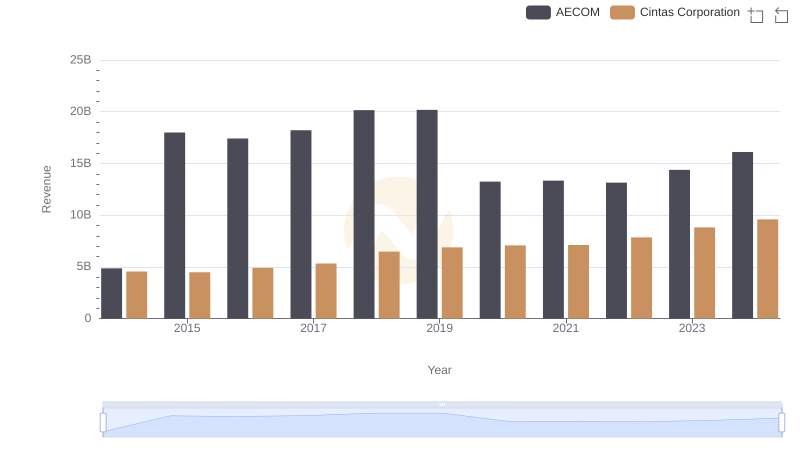
Breaking Down Revenue Trends: Cintas Corporation vs AECOM
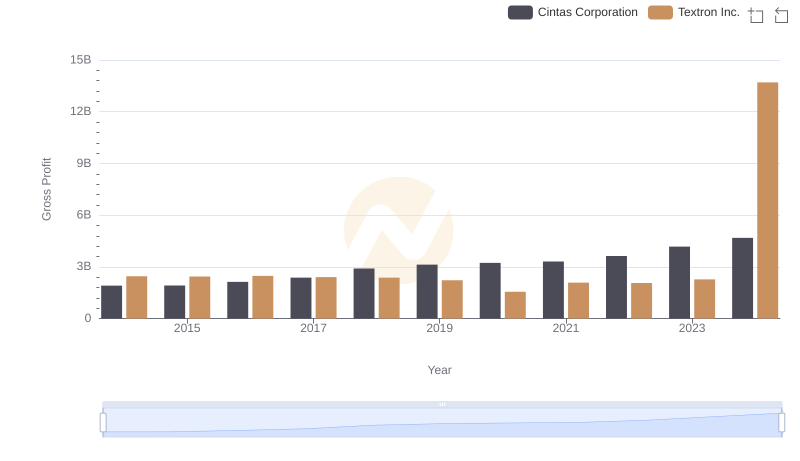
Key Insights on Gross Profit: Cintas Corporation vs Textron Inc.
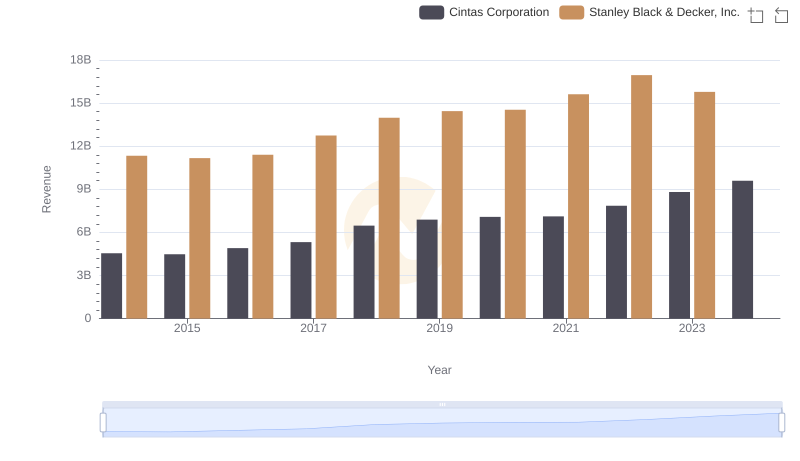
Breaking Down Revenue Trends: Cintas Corporation vs Stanley Black & Decker, Inc.
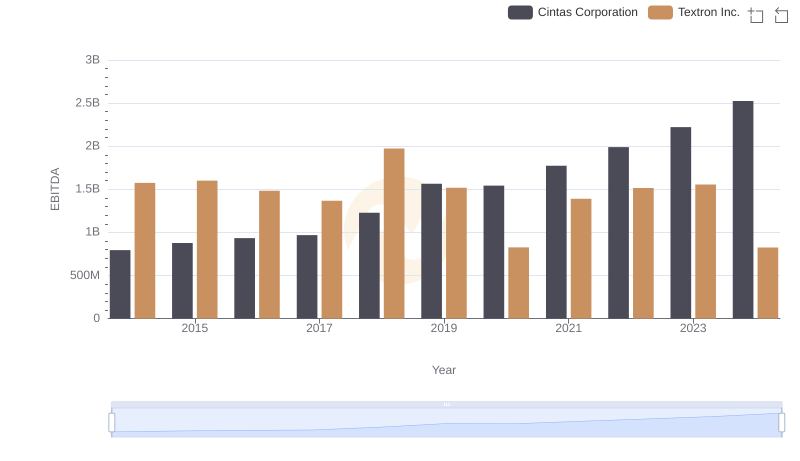
Comparative EBITDA Analysis: Cintas Corporation vs Textron Inc.