| __timestamp | Cintas Corporation | General Dynamics Corporation |
|---|---|---|
| Wednesday, January 1, 2014 | 1914386000 | 5873000000 |
| Thursday, January 1, 2015 | 1921337000 | 6130000000 |
| Friday, January 1, 2016 | 2129870000 | 6249000000 |
| Sunday, January 1, 2017 | 2380295000 | 6187000000 |
| Monday, January 1, 2018 | 2908523000 | 6715000000 |
| Tuesday, January 1, 2019 | 3128588000 | 7059000000 |
| Wednesday, January 1, 2020 | 3233748000 | 6325000000 |
| Friday, January 1, 2021 | 3314651000 | 6408000000 |
| Saturday, January 1, 2022 | 3632246000 | 6622000000 |
| Sunday, January 1, 2023 | 4173368000 | 6672000000 |
| Monday, January 1, 2024 | 4686416000 | 7364000000 |
Infusing magic into the data realm
In the competitive landscape of American industry, Cintas Corporation and General Dynamics Corporation stand as titans in their respective fields. Over the past decade, from 2014 to 2024, these companies have showcased distinct trajectories in gross profit growth. Cintas, a leader in corporate uniforms and facility services, has seen its gross profit soar by approximately 145%, from $1.9 billion in 2014 to an impressive $4.7 billion in 2024. This growth reflects a robust expansion strategy and increased market demand.
Conversely, General Dynamics, a major player in aerospace and defense, experienced a more modest growth of about 18% over the same period, with gross profits rising from $5.9 billion to $47.7 billion. This steady increase underscores the company's resilience in a fluctuating defense market. These trends highlight the diverse strategies and market conditions influencing two of America's industrial powerhouses.
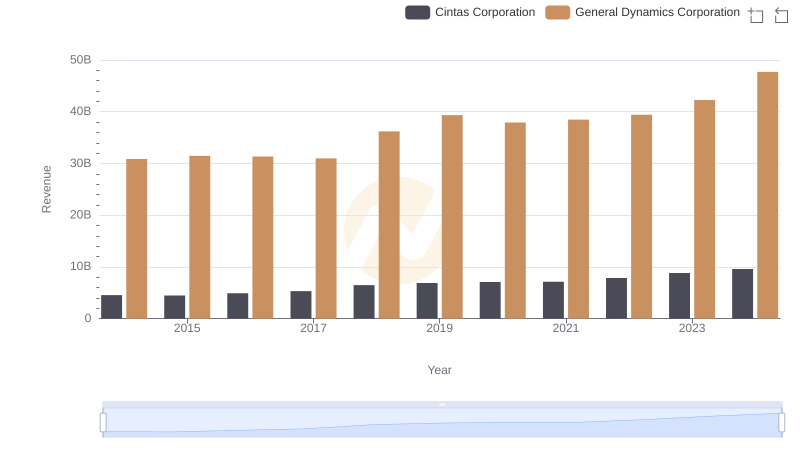
Comparing Revenue Performance: Cintas Corporation or General Dynamics Corporation?
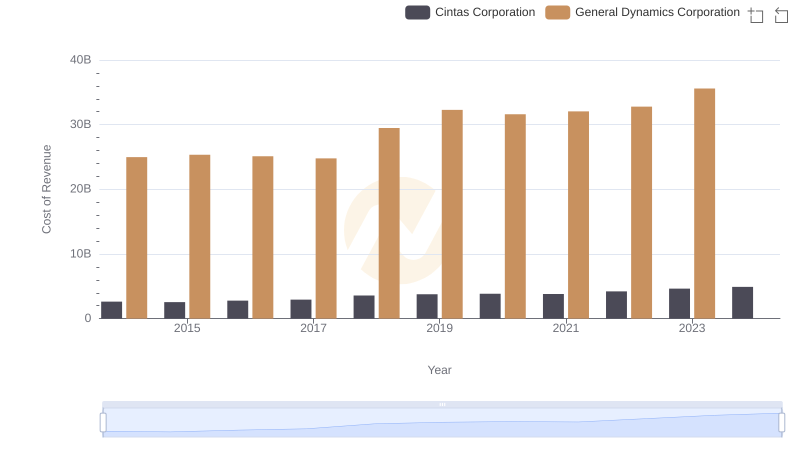
Cintas Corporation vs General Dynamics Corporation: Efficiency in Cost of Revenue Explored
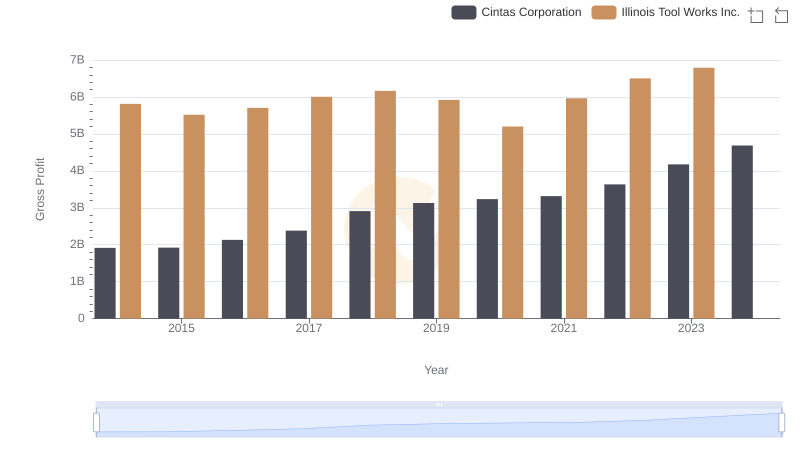
Key Insights on Gross Profit: Cintas Corporation vs Illinois Tool Works Inc.
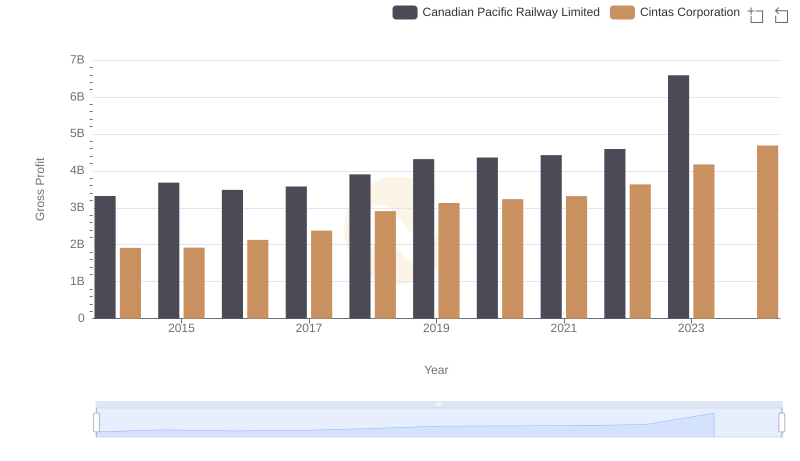
Gross Profit Comparison: Cintas Corporation and Canadian Pacific Railway Limited Trends
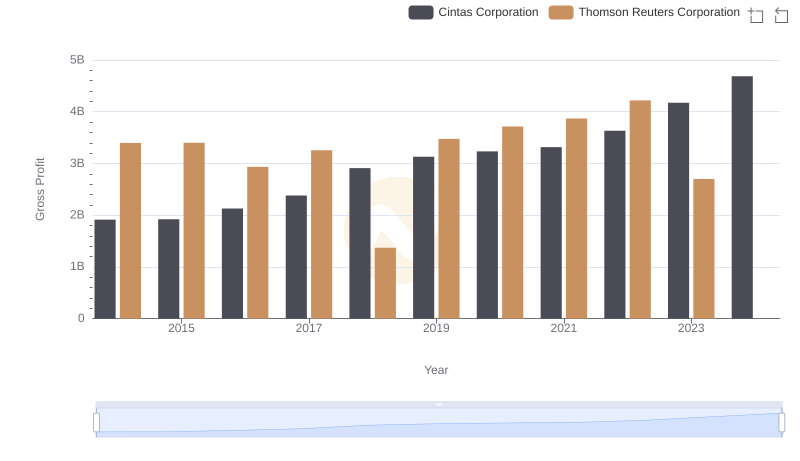
Cintas Corporation and Thomson Reuters Corporation: A Detailed Gross Profit Analysis
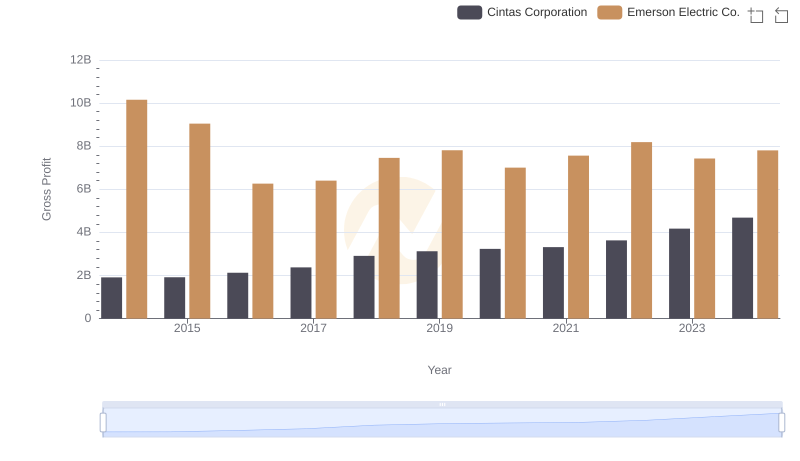
Who Generates Higher Gross Profit? Cintas Corporation or Emerson Electric Co.
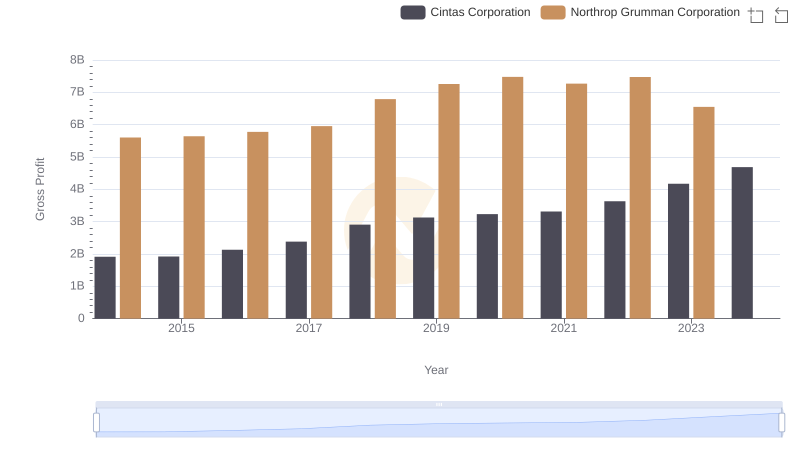
Cintas Corporation and Northrop Grumman Corporation: A Detailed Gross Profit Analysis
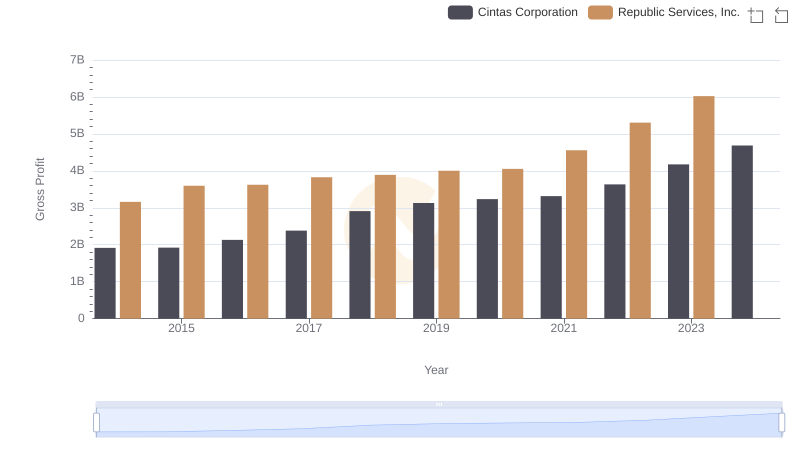
Cintas Corporation vs Republic Services, Inc.: A Gross Profit Performance Breakdown
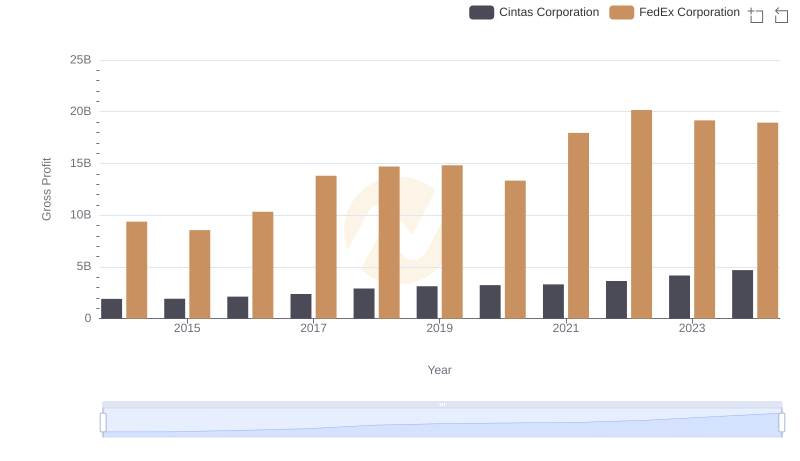
Gross Profit Comparison: Cintas Corporation and FedEx Corporation Trends
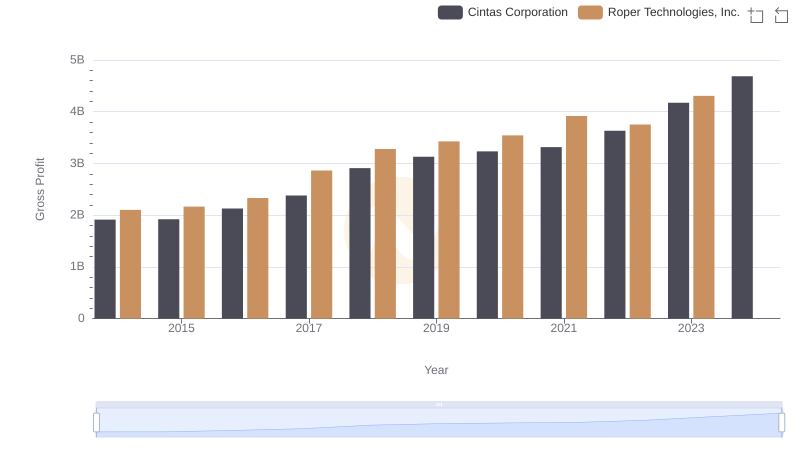
Key Insights on Gross Profit: Cintas Corporation vs Roper Technologies, Inc.
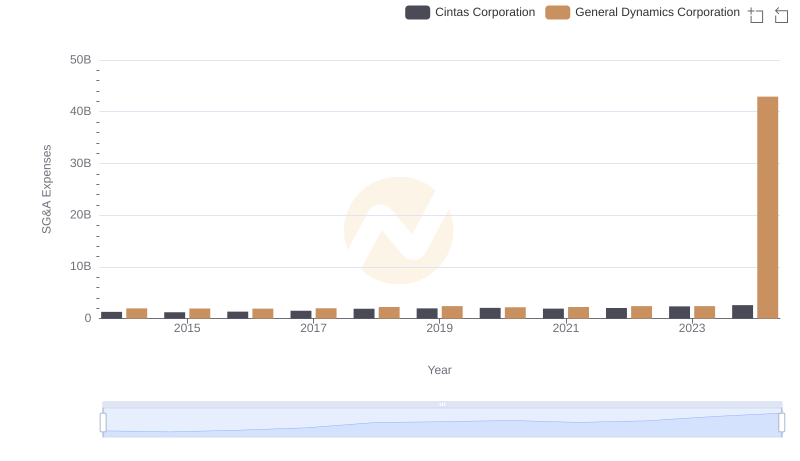
Comparing SG&A Expenses: Cintas Corporation vs General Dynamics Corporation Trends and Insights
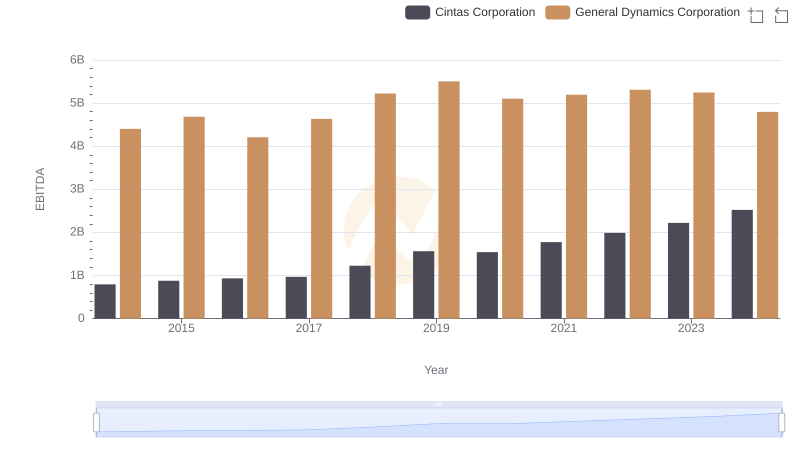
Comparative EBITDA Analysis: Cintas Corporation vs General Dynamics Corporation