| __timestamp | Cintas Corporation | General Dynamics Corporation |
|---|---|---|
| Wednesday, January 1, 2014 | 4551812000 | 30852000000 |
| Thursday, January 1, 2015 | 4476886000 | 31469000000 |
| Friday, January 1, 2016 | 4905458000 | 31353000000 |
| Sunday, January 1, 2017 | 5323381000 | 30973000000 |
| Monday, January 1, 2018 | 6476632000 | 36193000000 |
| Tuesday, January 1, 2019 | 6892303000 | 39350000000 |
| Wednesday, January 1, 2020 | 7085120000 | 37925000000 |
| Friday, January 1, 2021 | 7116340000 | 38469000000 |
| Saturday, January 1, 2022 | 7854459000 | 39407000000 |
| Sunday, January 1, 2023 | 8815769000 | 42272000000 |
| Monday, January 1, 2024 | 9596615000 | 47716000000 |
Unleashing insights
In the competitive landscape of American corporations, Cintas Corporation and General Dynamics Corporation have showcased remarkable revenue trajectories over the past decade. From 2014 to 2024, Cintas Corporation has seen its revenue nearly double, growing from approximately $4.6 billion to $9.6 billion. This represents an impressive growth rate of over 100%, highlighting Cintas's strategic expansion and market penetration.
On the other hand, General Dynamics Corporation, a stalwart in the defense and aerospace sector, has maintained a robust revenue stream, increasing from $30.9 billion in 2014 to $47.7 billion in 2024. This steady growth of around 54% underscores its resilience and adaptability in a challenging industry.
While Cintas's growth rate is higher, General Dynamics's revenue remains significantly larger, reflecting its established market dominance. This comparison offers a fascinating insight into how different sectors can achieve success through varied strategies.
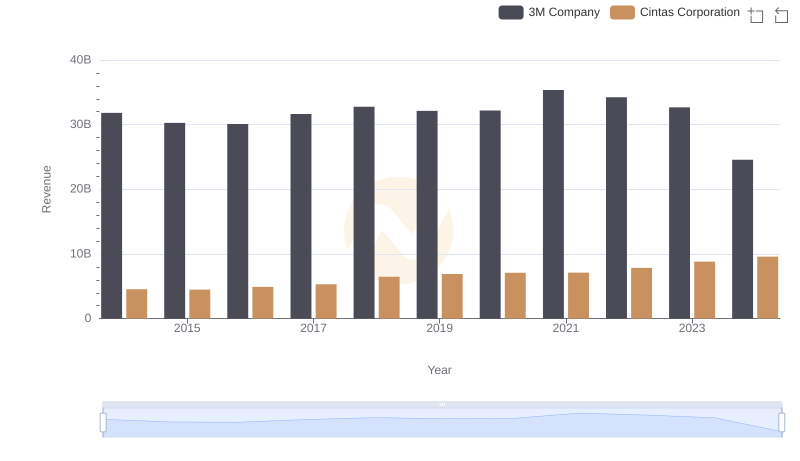
Cintas Corporation and 3M Company: A Comprehensive Revenue Analysis
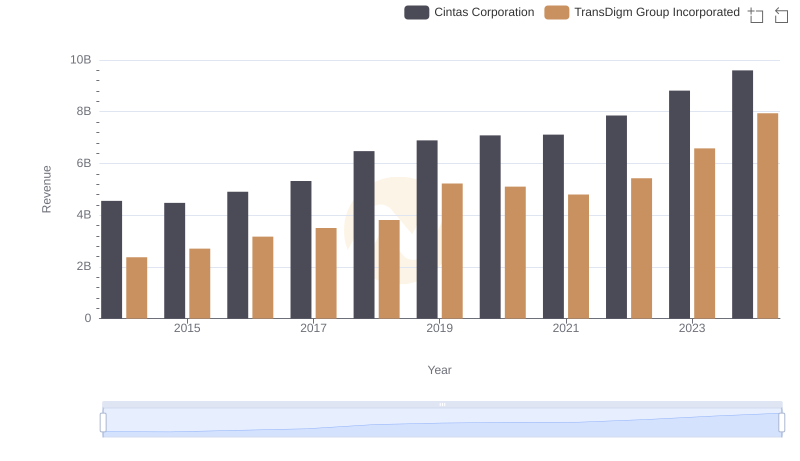
Cintas Corporation or TransDigm Group Incorporated: Who Leads in Yearly Revenue?
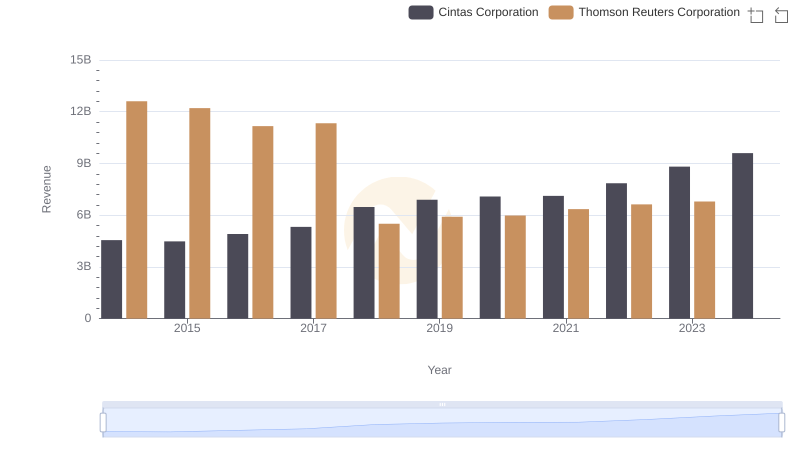
Breaking Down Revenue Trends: Cintas Corporation vs Thomson Reuters Corporation
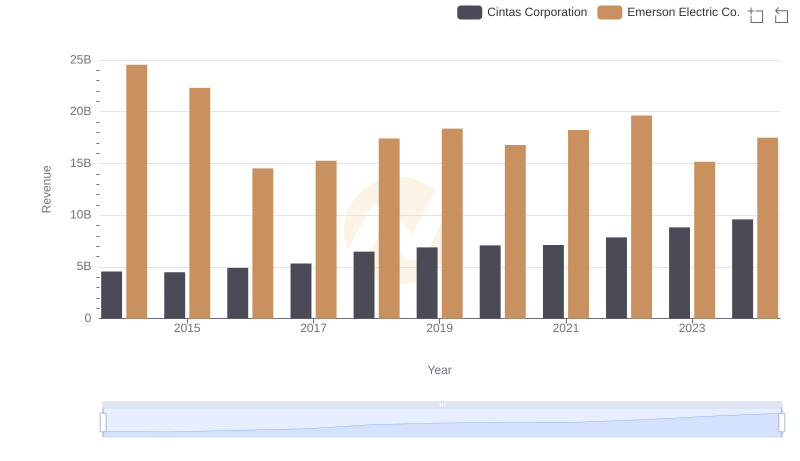
Revenue Showdown: Cintas Corporation vs Emerson Electric Co.
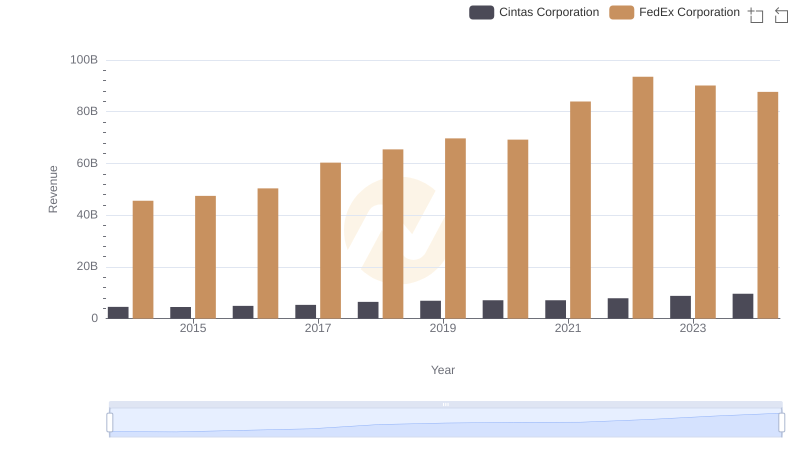
Cintas Corporation vs FedEx Corporation: Annual Revenue Growth Compared
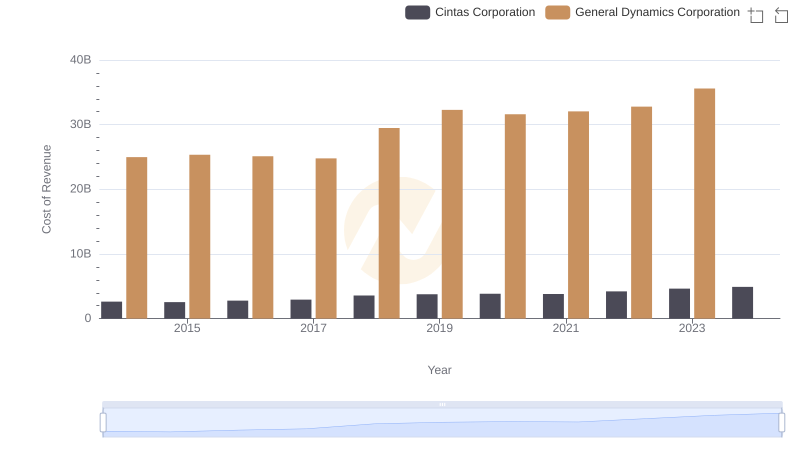
Cintas Corporation vs General Dynamics Corporation: Efficiency in Cost of Revenue Explored
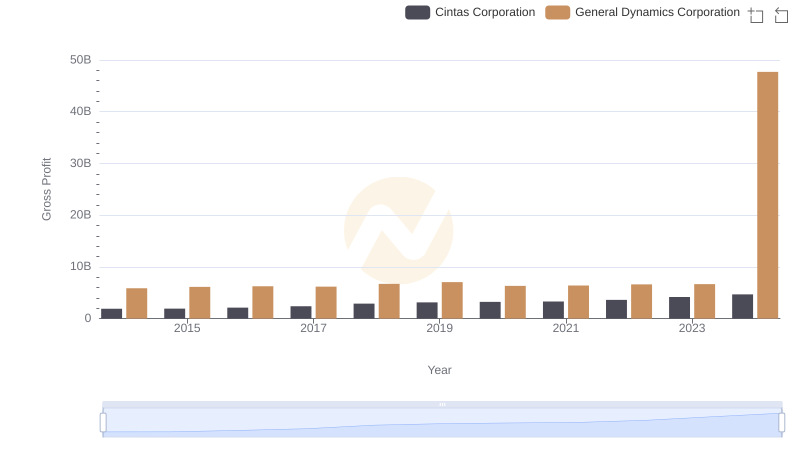
Gross Profit Trends Compared: Cintas Corporation vs General Dynamics Corporation
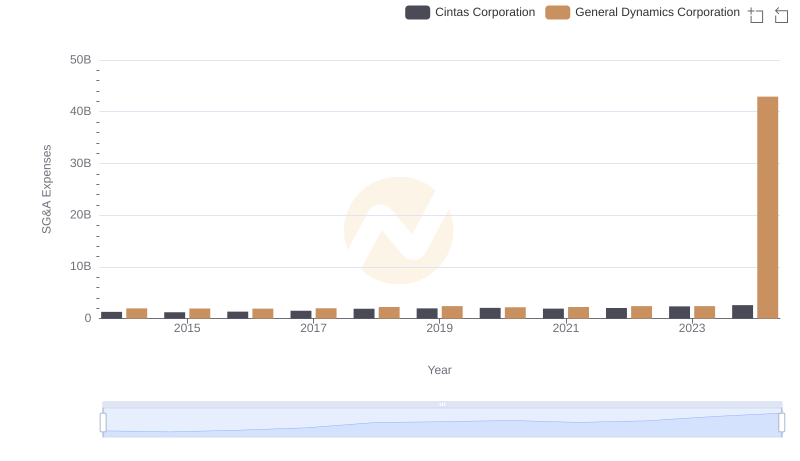
Comparing SG&A Expenses: Cintas Corporation vs General Dynamics Corporation Trends and Insights
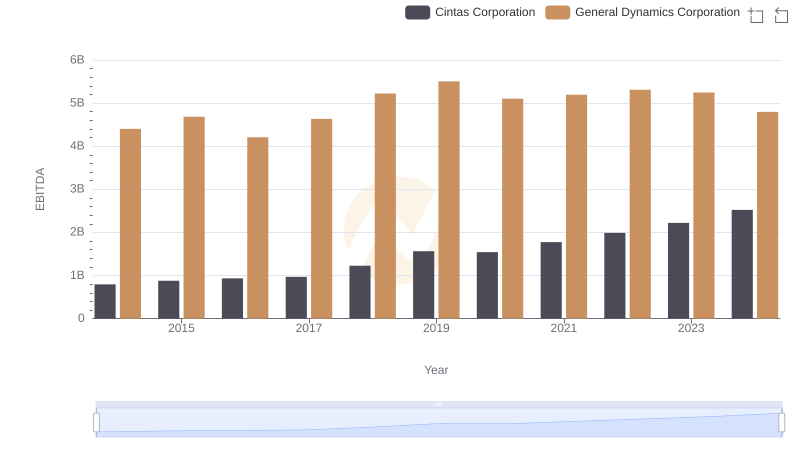
Comparative EBITDA Analysis: Cintas Corporation vs General Dynamics Corporation