| __timestamp | Cintas Corporation | Emerson Electric Co. |
|---|---|---|
| Wednesday, January 1, 2014 | 793811000 | 4397000000 |
| Thursday, January 1, 2015 | 877761000 | 4578000000 |
| Friday, January 1, 2016 | 933728000 | 3099000000 |
| Sunday, January 1, 2017 | 968293000 | 3172000000 |
| Monday, January 1, 2018 | 1227852000 | 3627000000 |
| Tuesday, January 1, 2019 | 1564228000 | 3882000000 |
| Wednesday, January 1, 2020 | 1542737000 | 3364000000 |
| Friday, January 1, 2021 | 1773591000 | 4047000000 |
| Saturday, January 1, 2022 | 1990046000 | 3502000000 |
| Sunday, January 1, 2023 | 2221676000 | 4038000000 |
| Monday, January 1, 2024 | 2523857000 | 4032000000 |
Unleashing the power of data
In the competitive landscape of industrial services and manufacturing, Cintas Corporation and Emerson Electric Co. have showcased remarkable financial trajectories over the past decade. From 2014 to 2024, Cintas Corporation's EBITDA has surged by over 200%, reflecting its robust growth strategy and operational efficiency. In contrast, Emerson Electric Co. has maintained a steady EBITDA, with a modest increase of around 8% over the same period.
Cintas Corporation: Starting at approximately $794 million in 2014, Cintas' EBITDA has consistently climbed, reaching an impressive $2.5 billion by 2024. This growth underscores Cintas' strategic expansions and market adaptability.
Emerson Electric Co.: Despite fluctuations, Emerson's EBITDA has remained relatively stable, peaking at $4.6 billion in 2015 and settling around $4 billion in 2024. This stability highlights Emerson's resilience in a volatile market.
The comparative analysis of these two industry giants offers valuable insights into their financial health and strategic directions.
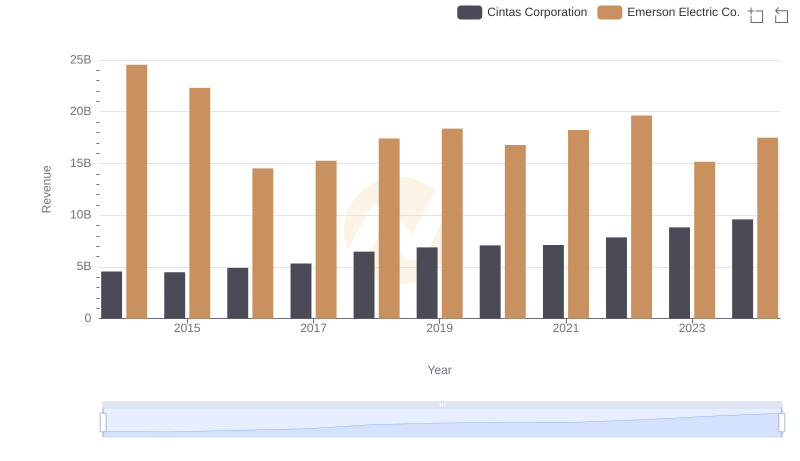
Revenue Showdown: Cintas Corporation vs Emerson Electric Co.
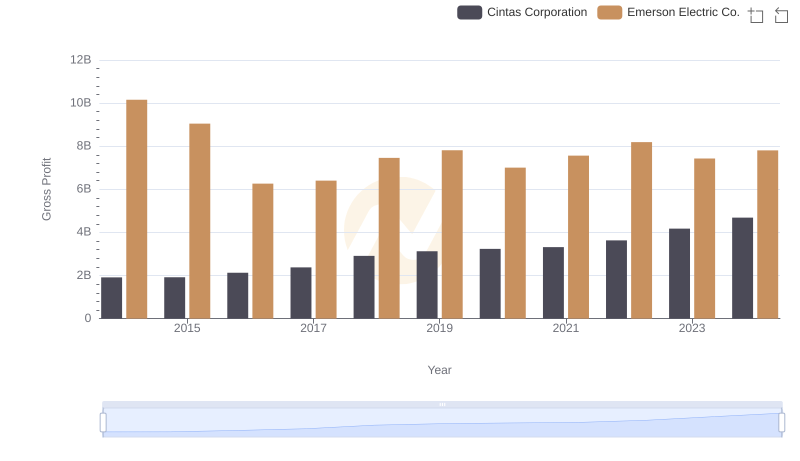
Who Generates Higher Gross Profit? Cintas Corporation or Emerson Electric Co.
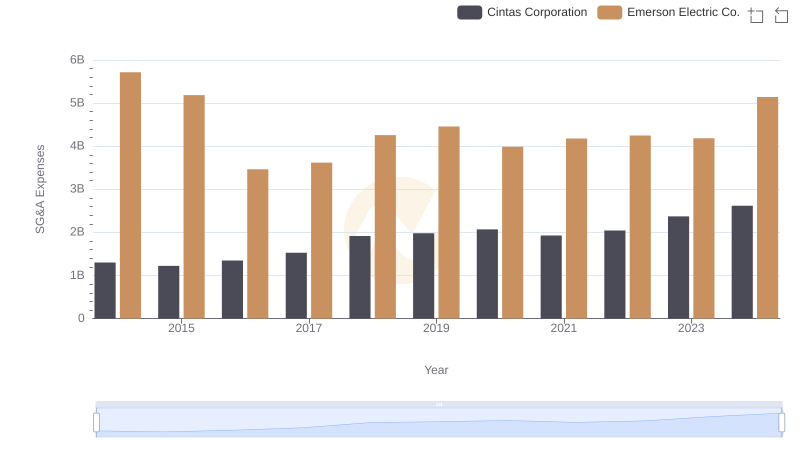
Cintas Corporation vs Emerson Electric Co.: SG&A Expense Trends
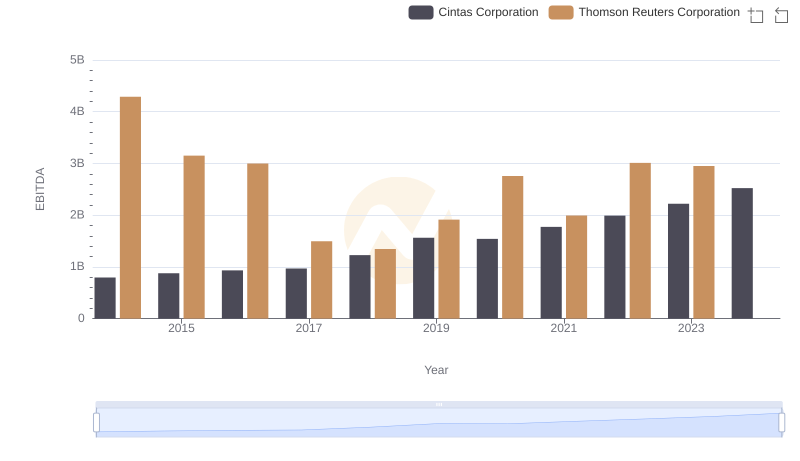
EBITDA Analysis: Evaluating Cintas Corporation Against Thomson Reuters Corporation
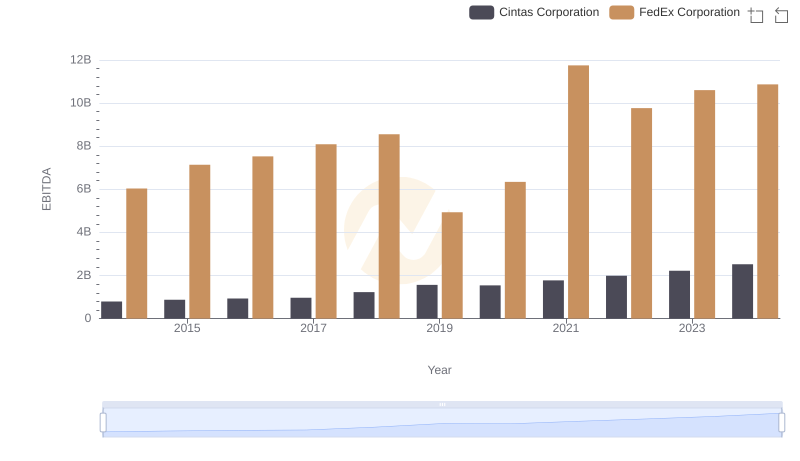
Professional EBITDA Benchmarking: Cintas Corporation vs FedEx Corporation
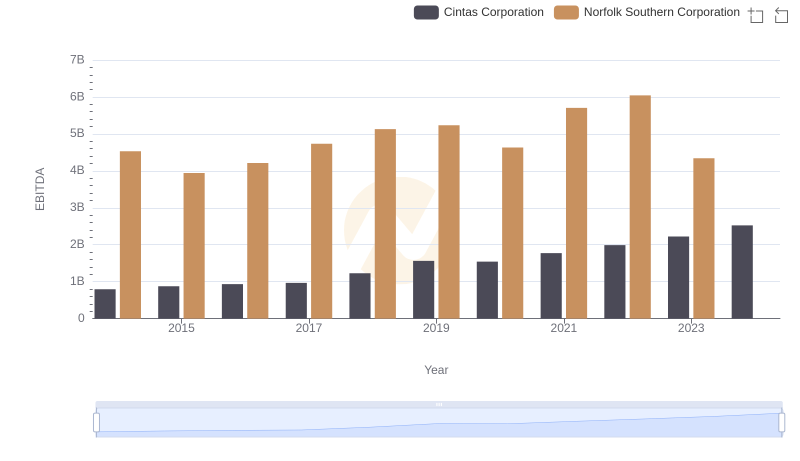
A Side-by-Side Analysis of EBITDA: Cintas Corporation and Norfolk Southern Corporation
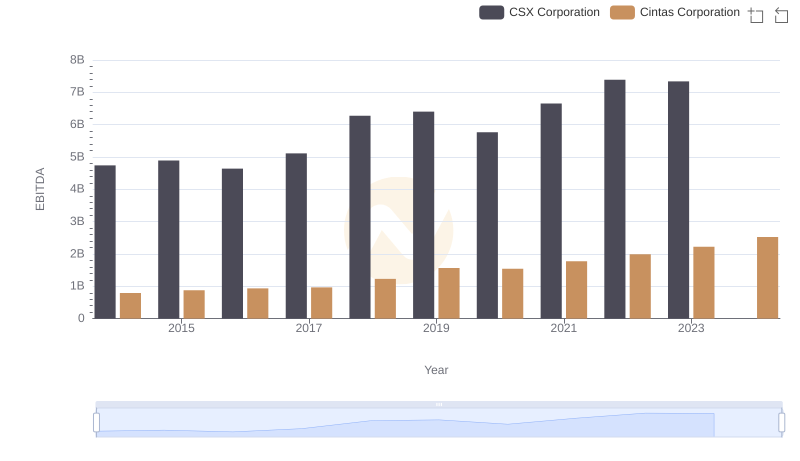
A Side-by-Side Analysis of EBITDA: Cintas Corporation and CSX Corporation
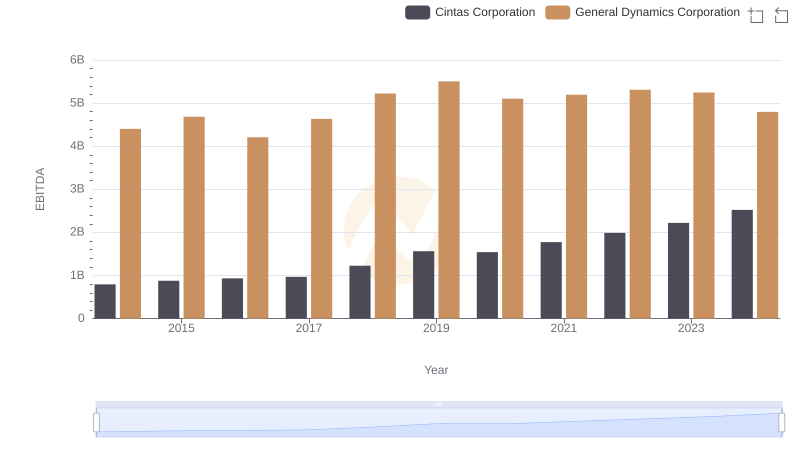
Comparative EBITDA Analysis: Cintas Corporation vs General Dynamics Corporation
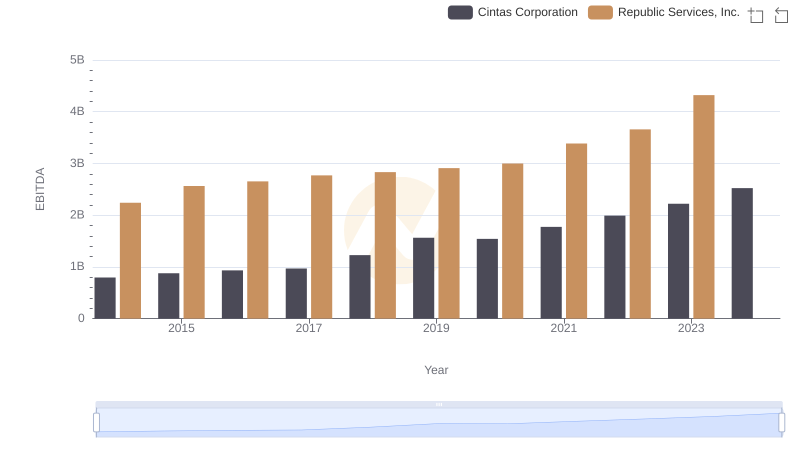
Cintas Corporation and Republic Services, Inc.: A Detailed Examination of EBITDA Performance
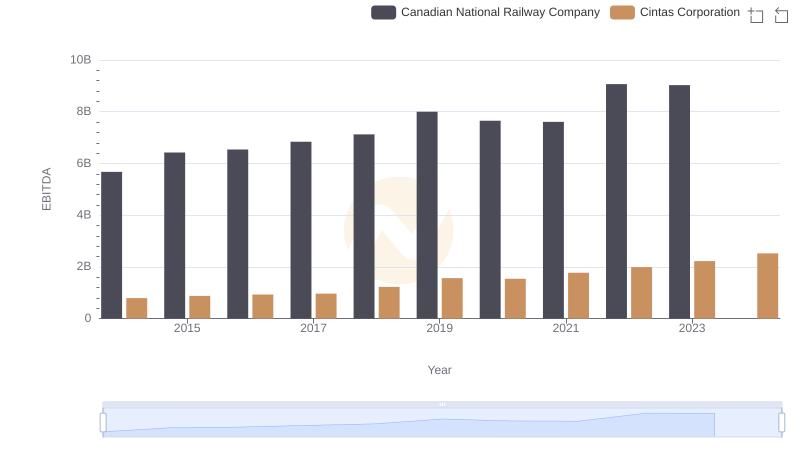
Professional EBITDA Benchmarking: Cintas Corporation vs Canadian National Railway Company
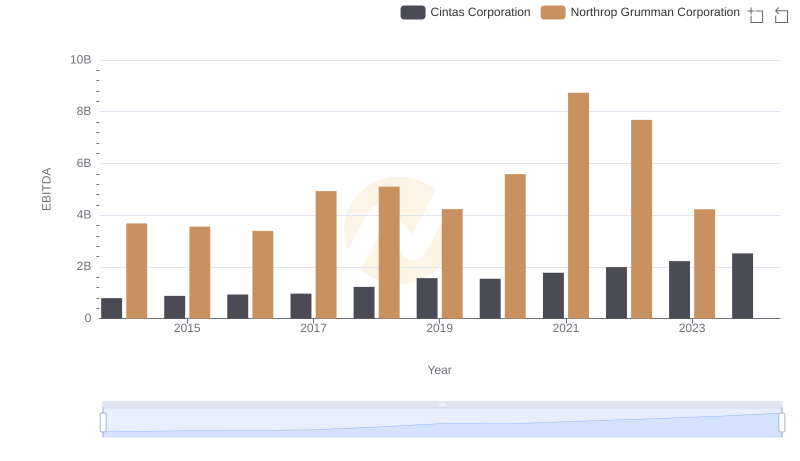
Comparative EBITDA Analysis: Cintas Corporation vs Northrop Grumman Corporation