| __timestamp | Cintas Corporation | Emerson Electric Co. |
|---|---|---|
| Wednesday, January 1, 2014 | 1302752000 | 5715000000 |
| Thursday, January 1, 2015 | 1224930000 | 5184000000 |
| Friday, January 1, 2016 | 1348122000 | 3464000000 |
| Sunday, January 1, 2017 | 1527380000 | 3618000000 |
| Monday, January 1, 2018 | 1916792000 | 4258000000 |
| Tuesday, January 1, 2019 | 1980644000 | 4457000000 |
| Wednesday, January 1, 2020 | 2071052000 | 3986000000 |
| Friday, January 1, 2021 | 1929159000 | 4179000000 |
| Saturday, January 1, 2022 | 2044876000 | 4248000000 |
| Sunday, January 1, 2023 | 2370704000 | 4186000000 |
| Monday, January 1, 2024 | 2617783000 | 5142000000 |
Unveiling the hidden dimensions of data
In the ever-evolving landscape of corporate finance, understanding the trends in Selling, General, and Administrative (SG&A) expenses is crucial for investors and analysts alike. Over the past decade, Cintas Corporation and Emerson Electric Co. have showcased distinct trajectories in their SG&A expenditures.
From 2014 to 2024, Cintas Corporation's SG&A expenses have surged by approximately 101%, reflecting a strategic expansion and increased operational activities. Notably, the expenses rose from around $1.3 billion in 2014 to an estimated $2.6 billion in 2024, indicating a robust growth strategy.
Conversely, Emerson Electric Co. experienced a more volatile trend. Starting at $5.7 billion in 2014, their SG&A expenses dipped to $3.5 billion in 2016, before stabilizing around $4.2 billion in recent years. This fluctuation suggests a period of restructuring and cost optimization.
These insights into SG&A trends provide a window into the strategic priorities and operational efficiencies of these industry giants.
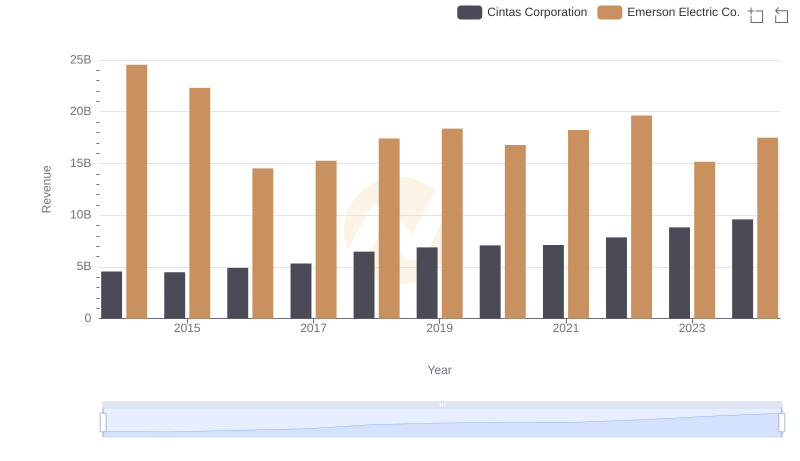
Revenue Showdown: Cintas Corporation vs Emerson Electric Co.
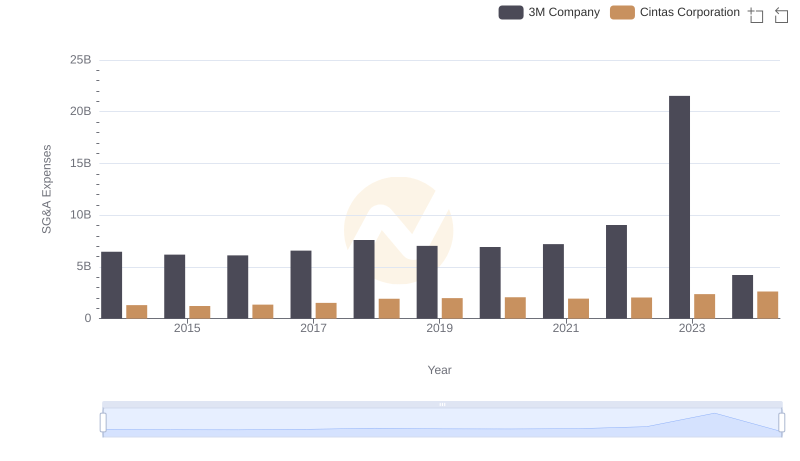
Cintas Corporation and 3M Company: SG&A Spending Patterns Compared
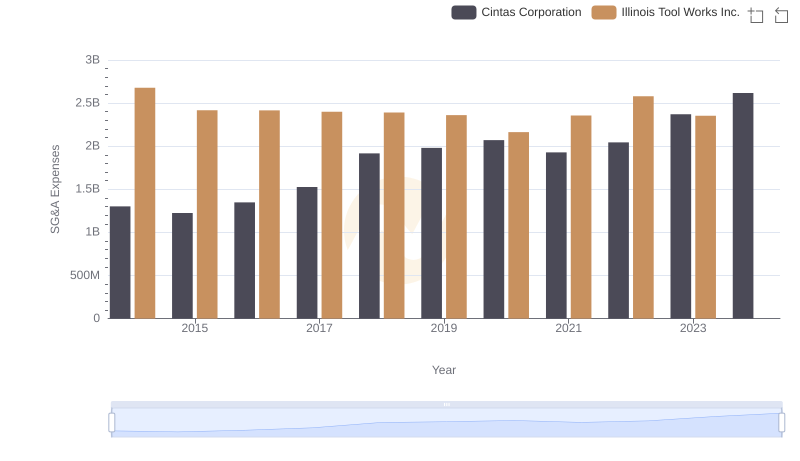
Breaking Down SG&A Expenses: Cintas Corporation vs Illinois Tool Works Inc.
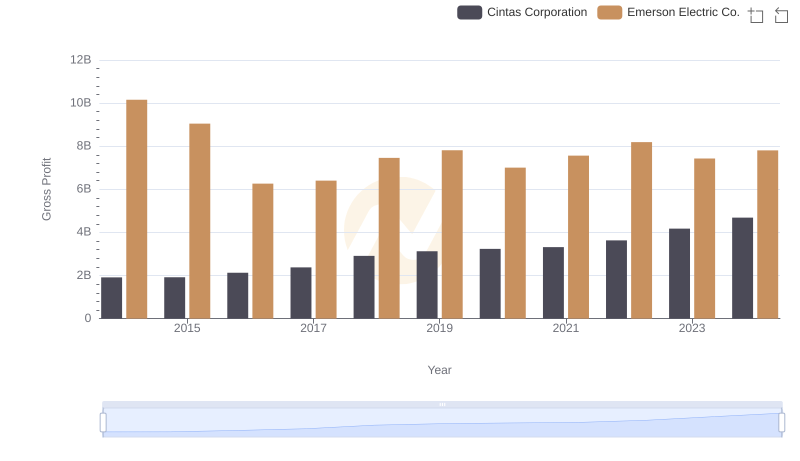
Who Generates Higher Gross Profit? Cintas Corporation or Emerson Electric Co.

Cost Management Insights: SG&A Expenses for Cintas Corporation and Republic Services, Inc.
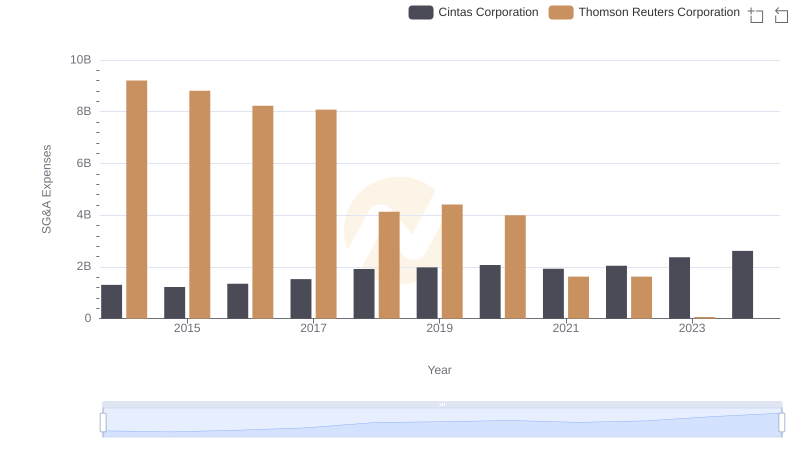
Cost Management Insights: SG&A Expenses for Cintas Corporation and Thomson Reuters Corporation
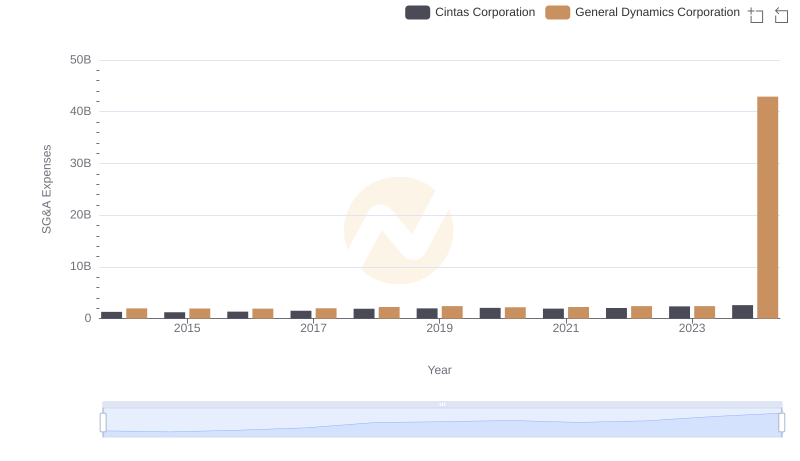
Comparing SG&A Expenses: Cintas Corporation vs General Dynamics Corporation Trends and Insights
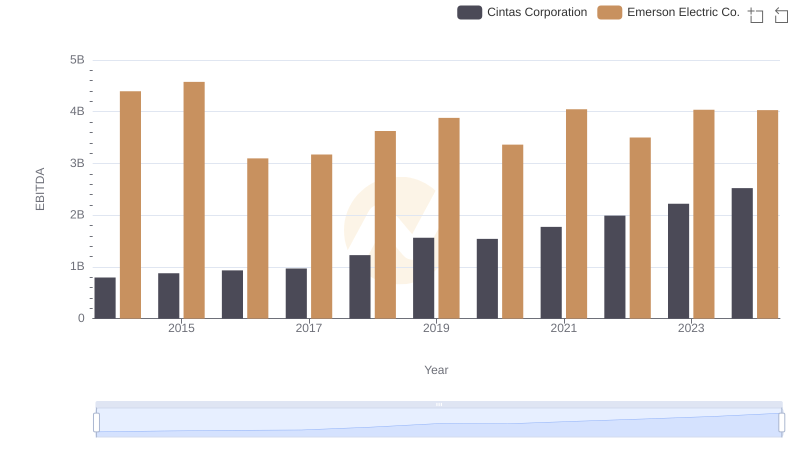
Comparative EBITDA Analysis: Cintas Corporation vs Emerson Electric Co.
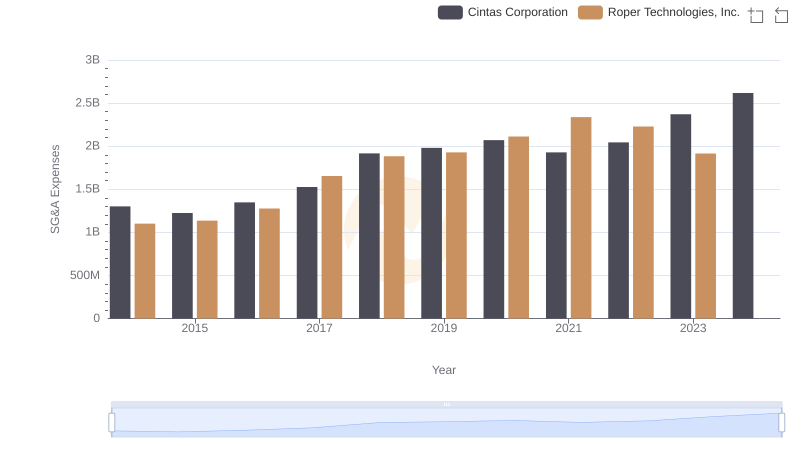
Comparing SG&A Expenses: Cintas Corporation vs Roper Technologies, Inc. Trends and Insights
Cintas Corporation vs W.W. Grainger, Inc.: SG&A Expense Trends