| __timestamp | AMETEK, Inc. | Nordson Corporation |
|---|---|---|
| Wednesday, January 1, 2014 | 1424947000 | 945098000 |
| Thursday, January 1, 2015 | 1425015000 | 913964000 |
| Friday, January 1, 2016 | 1264867000 | 993499000 |
| Sunday, January 1, 2017 | 1448739000 | 1139001000 |
| Monday, January 1, 2018 | 1659562000 | 1235965000 |
| Tuesday, January 1, 2019 | 1787660000 | 1192103000 |
| Wednesday, January 1, 2020 | 1543514000 | 1130468000 |
| Friday, January 1, 2021 | 1912614000 | 1324080000 |
| Saturday, January 1, 2022 | 2145269000 | 1426536000 |
| Sunday, January 1, 2023 | 2384465001 | 1425405000 |
| Monday, January 1, 2024 | 6941180000 | 1486129000 |
In pursuit of knowledge
In the competitive landscape of industrial manufacturing, AMETEK, Inc. and Nordson Corporation have been pivotal players. Over the past decade, AMETEK has consistently outperformed Nordson in terms of gross profit, showcasing a robust growth trajectory. From 2014 to 2023, AMETEK's gross profit surged by approximately 67%, peaking in 2023. In contrast, Nordson's growth was more modest, with a 51% increase over the same period.
The data for 2024 is incomplete, highlighting the dynamic nature of the industry and the potential for future shifts in market leadership.
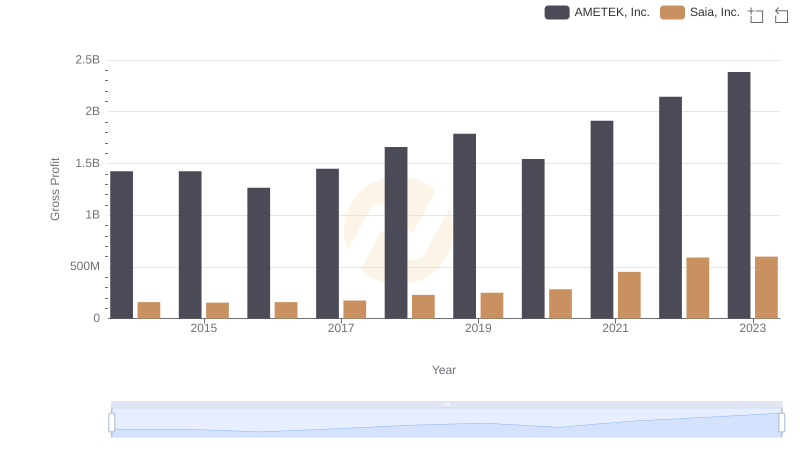
Gross Profit Trends Compared: AMETEK, Inc. vs Saia, Inc.
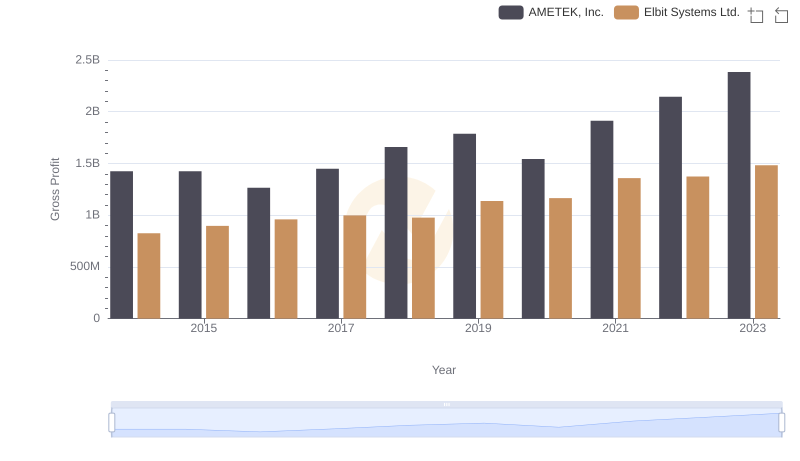
Key Insights on Gross Profit: AMETEK, Inc. vs Elbit Systems Ltd.
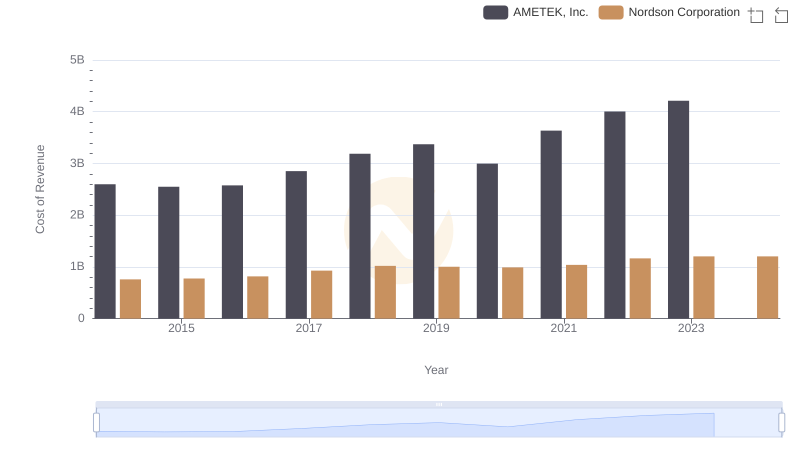
Analyzing Cost of Revenue: AMETEK, Inc. and Nordson Corporation
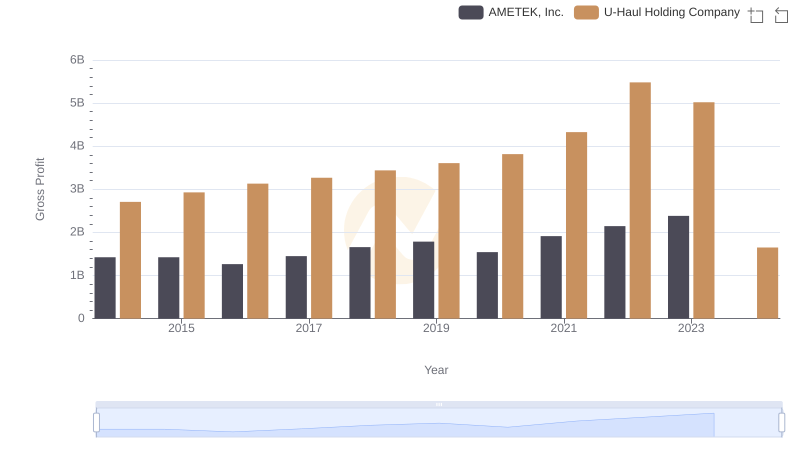
AMETEK, Inc. vs U-Haul Holding Company: A Gross Profit Performance Breakdown
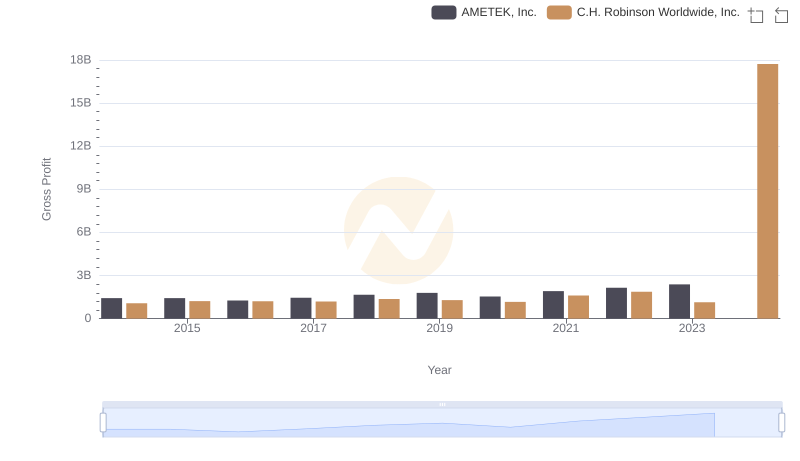
Gross Profit Analysis: Comparing AMETEK, Inc. and C.H. Robinson Worldwide, Inc.
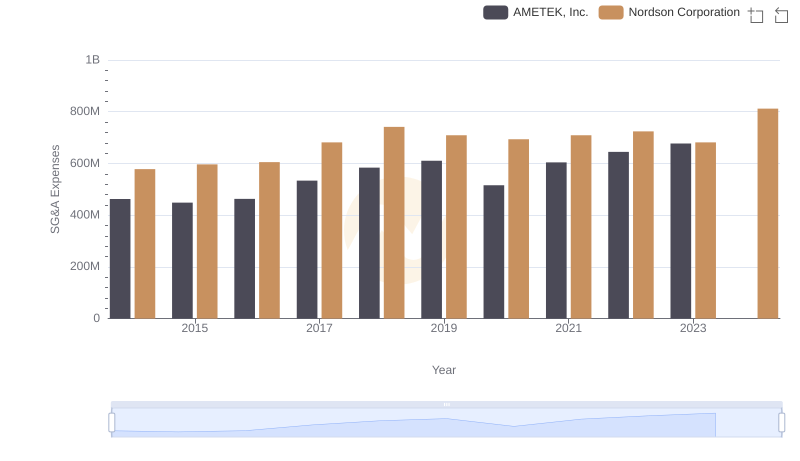
AMETEK, Inc. vs Nordson Corporation: SG&A Expense Trends
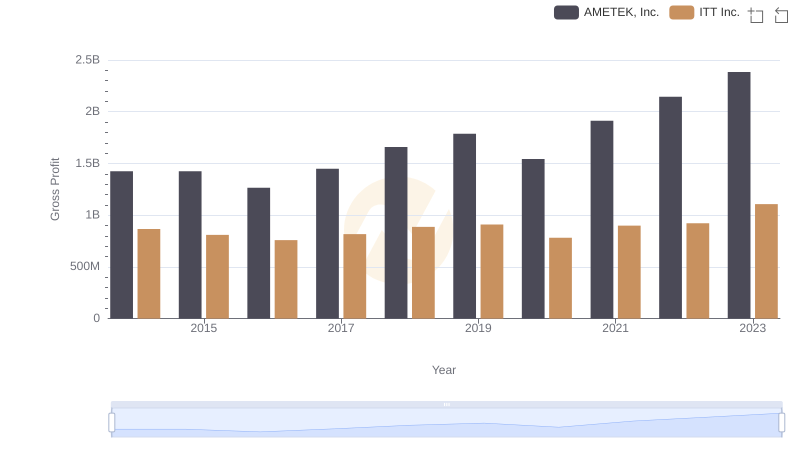
AMETEK, Inc. vs ITT Inc.: A Gross Profit Performance Breakdown
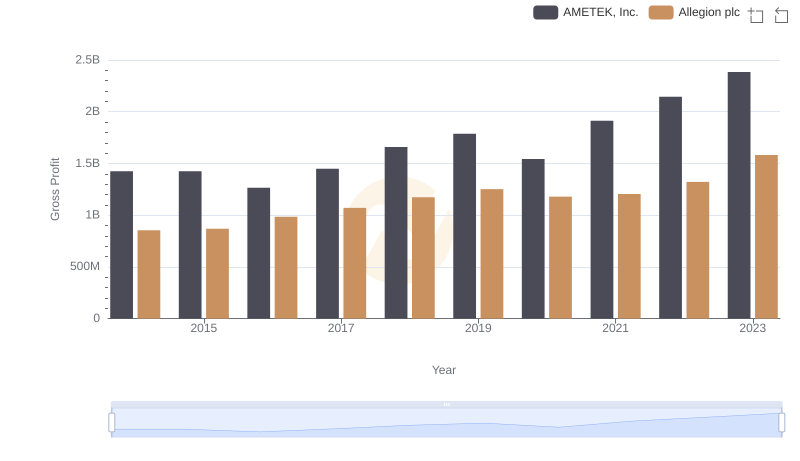
AMETEK, Inc. vs Allegion plc: A Gross Profit Performance Breakdown
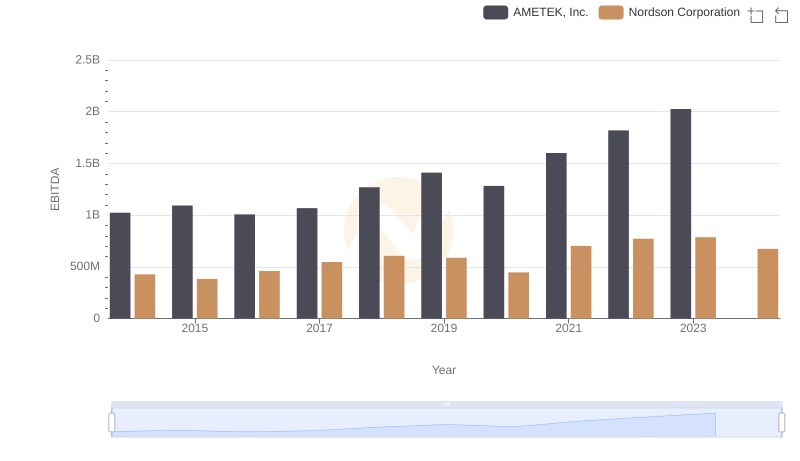
Comparative EBITDA Analysis: AMETEK, Inc. vs Nordson Corporation