| __timestamp | Cisco Systems, Inc. | VeriSign, Inc. |
|---|---|---|
| Wednesday, January 1, 2014 | 19373000000 | 188425000 |
| Thursday, January 1, 2015 | 19480000000 | 192788000 |
| Friday, January 1, 2016 | 18287000000 | 198242000 |
| Sunday, January 1, 2017 | 17781000000 | 193326000 |
| Monday, January 1, 2018 | 18724000000 | 192134000 |
| Tuesday, January 1, 2019 | 19238000000 | 180467000 |
| Wednesday, January 1, 2020 | 17618000000 | 180177000 |
| Friday, January 1, 2021 | 17924000000 | 191933000 |
| Saturday, January 1, 2022 | 19309000000 | 200700000 |
| Sunday, January 1, 2023 | 21245000000 | 197300000 |
| Monday, January 1, 2024 | 18975000000 | 191400000 |
Unleashing insights
In the ever-evolving tech industry, understanding cost structures is crucial for evaluating company performance. Cisco Systems, Inc. and VeriSign, Inc. offer intriguing insights into cost management over the past decade. From 2014 to 2023, Cisco's cost of revenue fluctuated, peaking in 2023 with a 10% increase from 2022. This suggests strategic investments or operational shifts. Conversely, VeriSign's cost of revenue remained relatively stable, with a slight uptick in 2022, indicating consistent cost control.
These trends highlight the contrasting strategies of two tech giants, offering valuable lessons in cost management and operational efficiency.
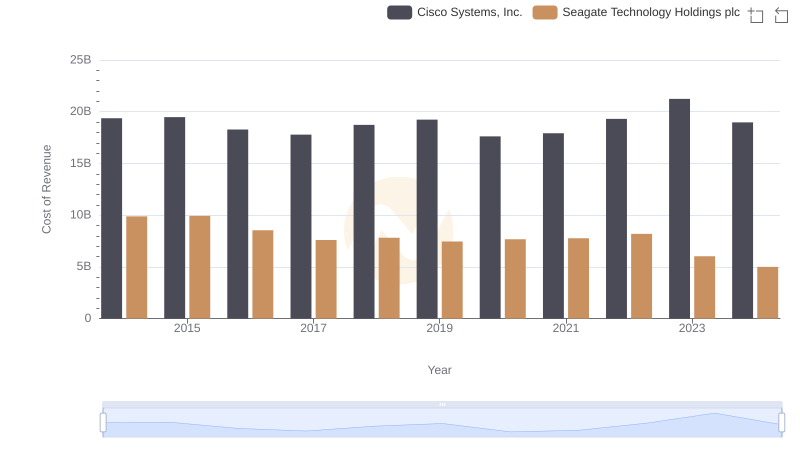
Analyzing Cost of Revenue: Cisco Systems, Inc. and Seagate Technology Holdings plc
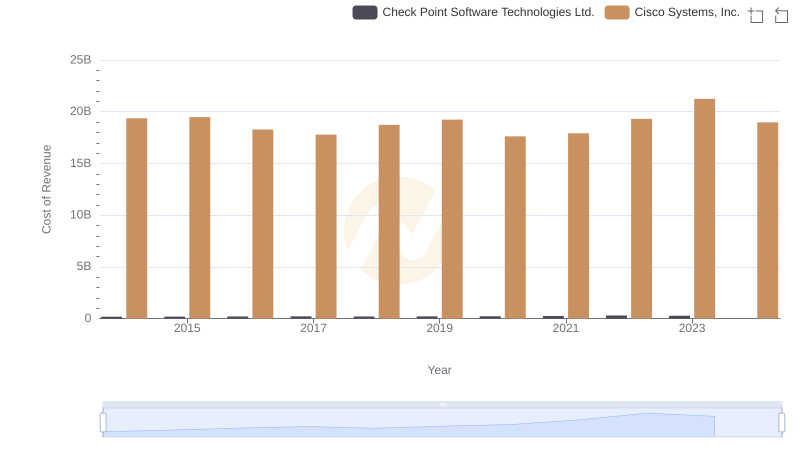
Cisco Systems, Inc. vs Check Point Software Technologies Ltd.: Efficiency in Cost of Revenue Explored
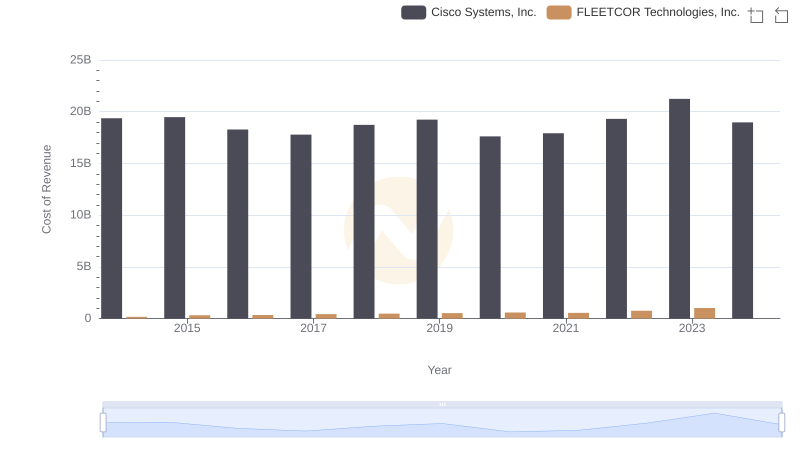
Cost Insights: Breaking Down Cisco Systems, Inc. and FLEETCOR Technologies, Inc.'s Expenses
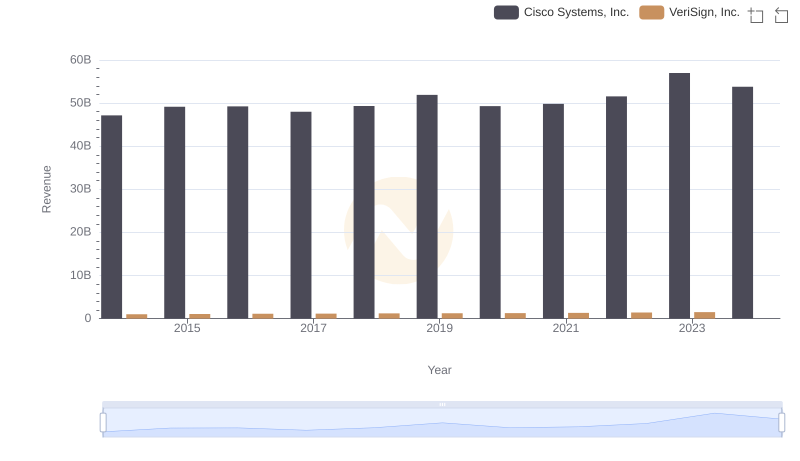
Comparing Revenue Performance: Cisco Systems, Inc. or VeriSign, Inc.?
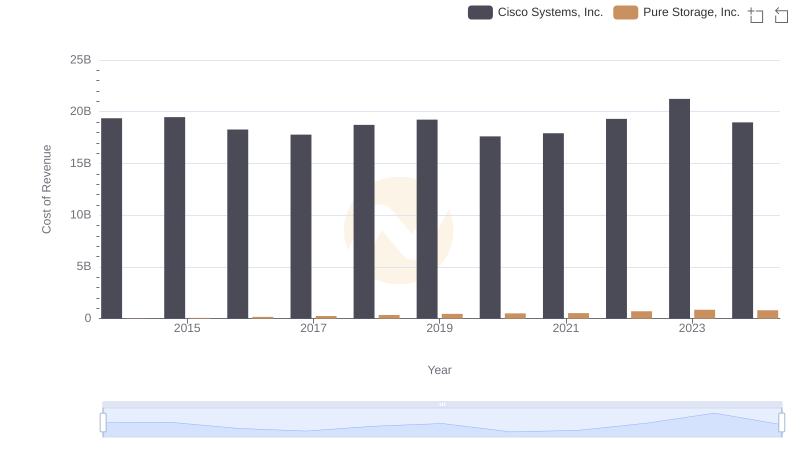
Cost of Revenue: Key Insights for Cisco Systems, Inc. and Pure Storage, Inc.
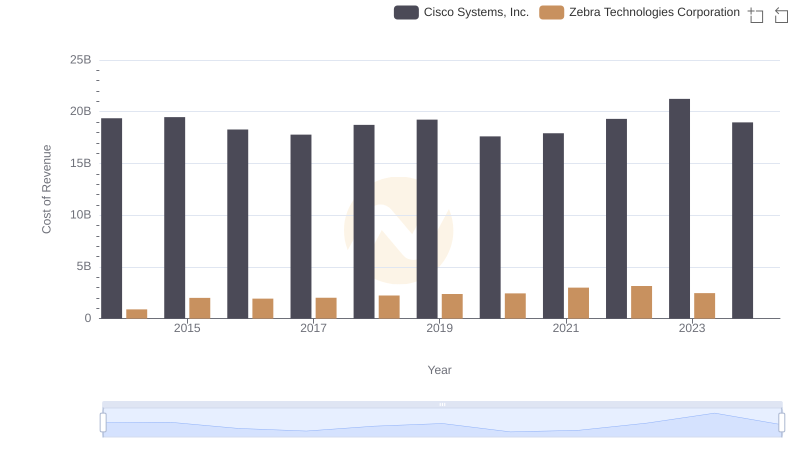
Cost Insights: Breaking Down Cisco Systems, Inc. and Zebra Technologies Corporation's Expenses
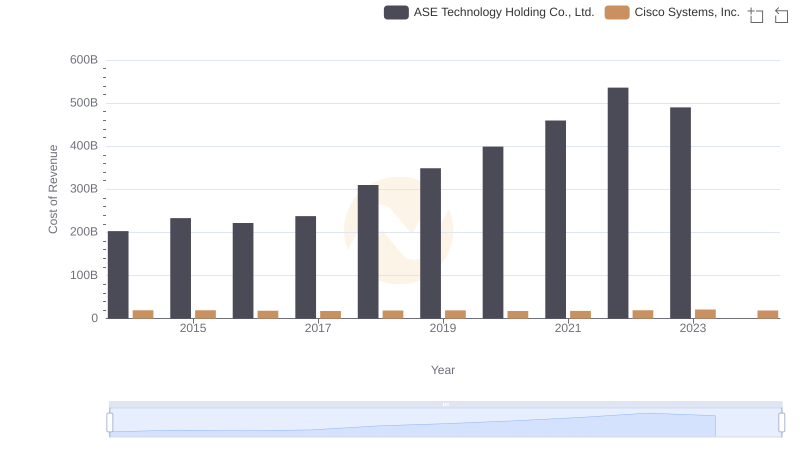
Analyzing Cost of Revenue: Cisco Systems, Inc. and ASE Technology Holding Co., Ltd.
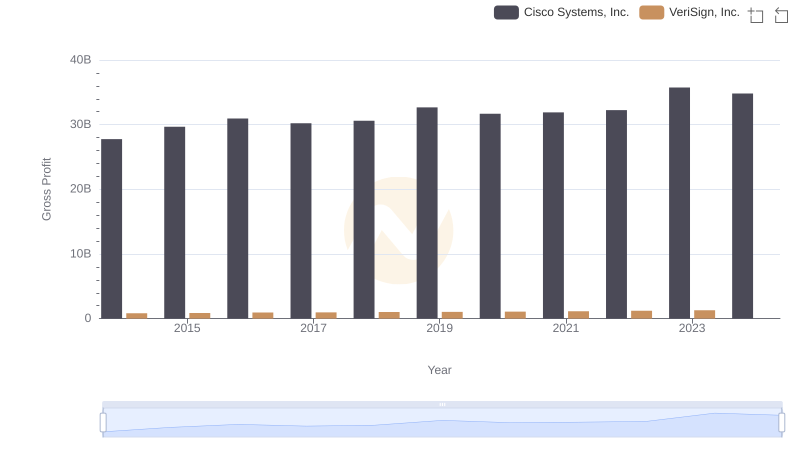
Cisco Systems, Inc. vs VeriSign, Inc.: A Gross Profit Performance Breakdown
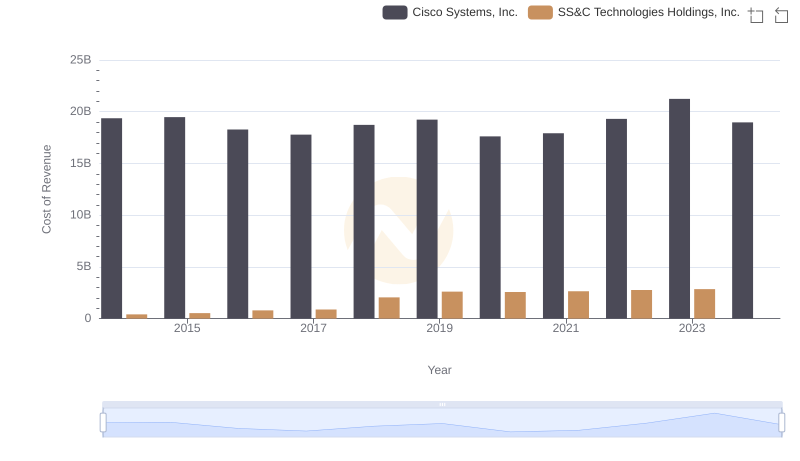
Cisco Systems, Inc. vs SS&C Technologies Holdings, Inc.: Efficiency in Cost of Revenue Explored
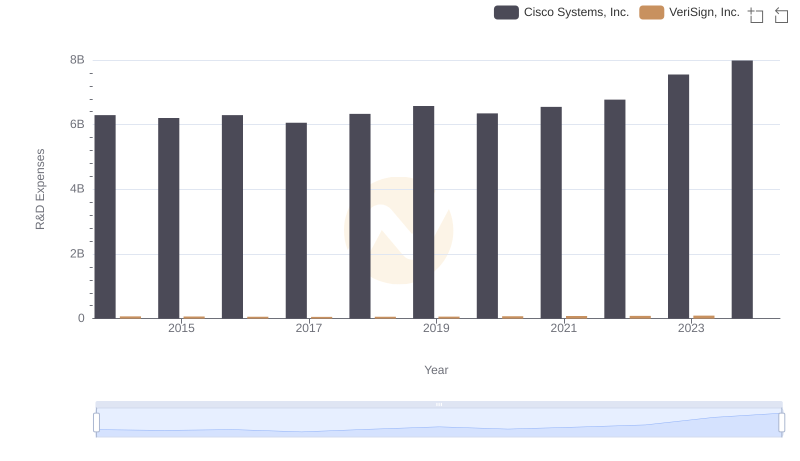
R&D Insights: How Cisco Systems, Inc. and VeriSign, Inc. Allocate Funds
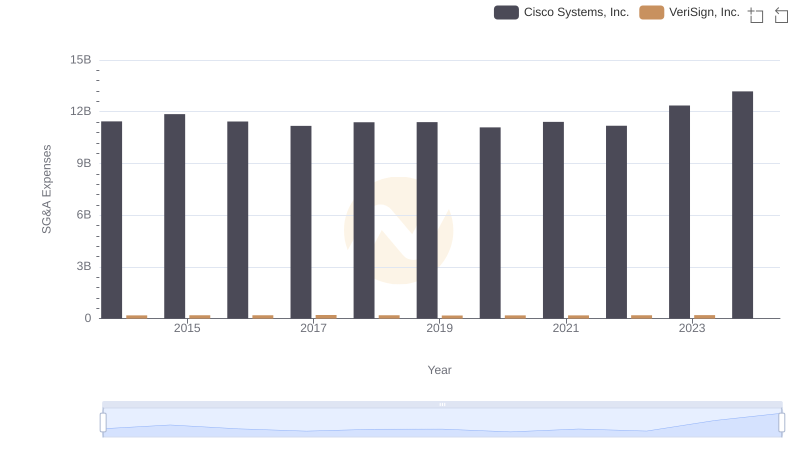
Cisco Systems, Inc. vs VeriSign, Inc.: SG&A Expense Trends
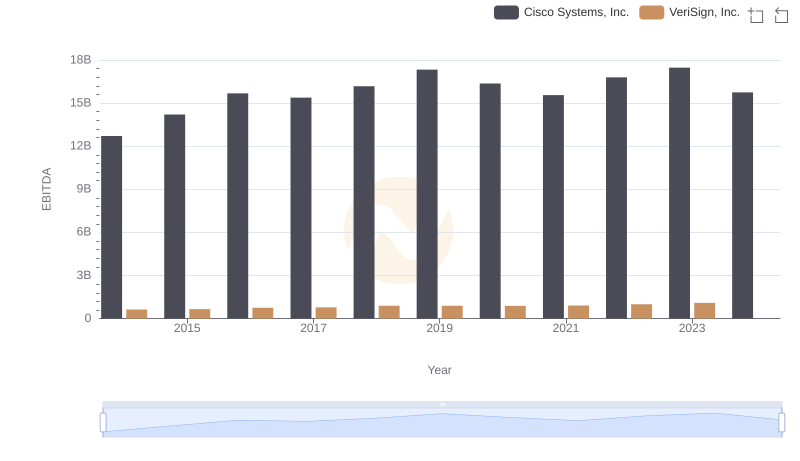
EBITDA Metrics Evaluated: Cisco Systems, Inc. vs VeriSign, Inc.