| __timestamp | Cisco Systems, Inc. | SS&C Technologies Holdings, Inc. |
|---|---|---|
| Wednesday, January 1, 2014 | 19373000000 | 410731000 |
| Thursday, January 1, 2015 | 19480000000 | 532350000 |
| Friday, January 1, 2016 | 18287000000 | 800489000 |
| Sunday, January 1, 2017 | 17781000000 | 886425000 |
| Monday, January 1, 2018 | 18724000000 | 2051100000 |
| Tuesday, January 1, 2019 | 19238000000 | 2611700000 |
| Wednesday, January 1, 2020 | 17618000000 | 2574100000 |
| Friday, January 1, 2021 | 17924000000 | 2641700000 |
| Saturday, January 1, 2022 | 19309000000 | 2767700000 |
| Sunday, January 1, 2023 | 21245000000 | 2851000000 |
| Monday, January 1, 2024 | 18975000000 | 3018400000 |
Infusing magic into the data realm
In the ever-evolving tech industry, cost efficiency is a critical metric for success. This analysis delves into the cost of revenue trends for Cisco Systems, Inc. and SS&C Technologies Holdings, Inc. from 2014 to 2023. Cisco, a stalwart in networking, consistently maintained a higher cost of revenue, peaking at approximately $21.2 billion in 2023. In contrast, SS&C Technologies, a leader in financial services software, showed a steady increase, reaching around $2.85 billion in the same year. Notably, Cisco's cost of revenue decreased by about 2% from 2014 to 2020, while SS&C's surged by over 600% during the same period. This stark contrast highlights SS&C's aggressive growth strategy. However, data for 2024 is incomplete, leaving room for speculation on future trends. As these companies navigate the competitive landscape, their cost efficiency strategies will be pivotal in shaping their market positions.
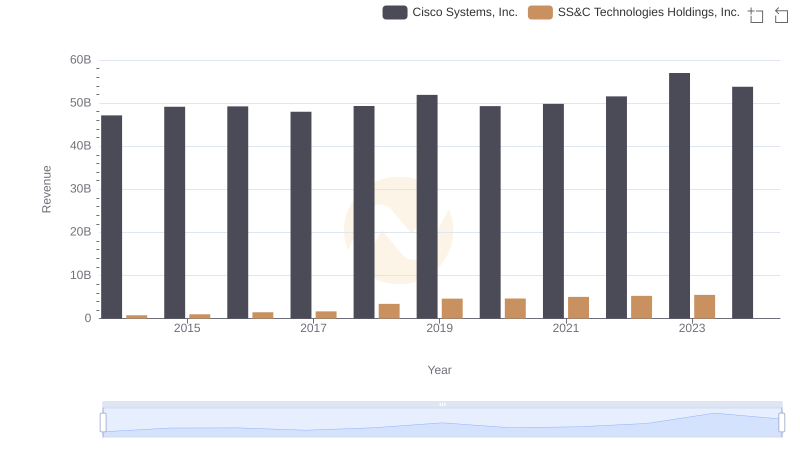
Revenue Showdown: Cisco Systems, Inc. vs SS&C Technologies Holdings, Inc.
Cost of Revenue: Key Insights for Cisco Systems, Inc. and Pure Storage, Inc.
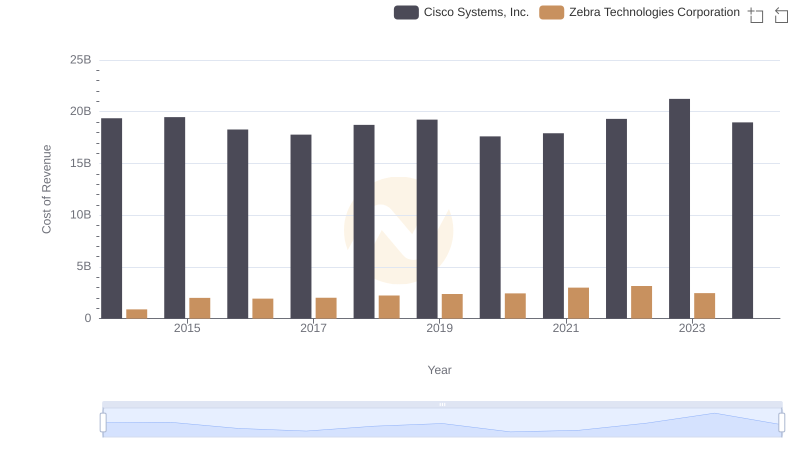
Cost Insights: Breaking Down Cisco Systems, Inc. and Zebra Technologies Corporation's Expenses
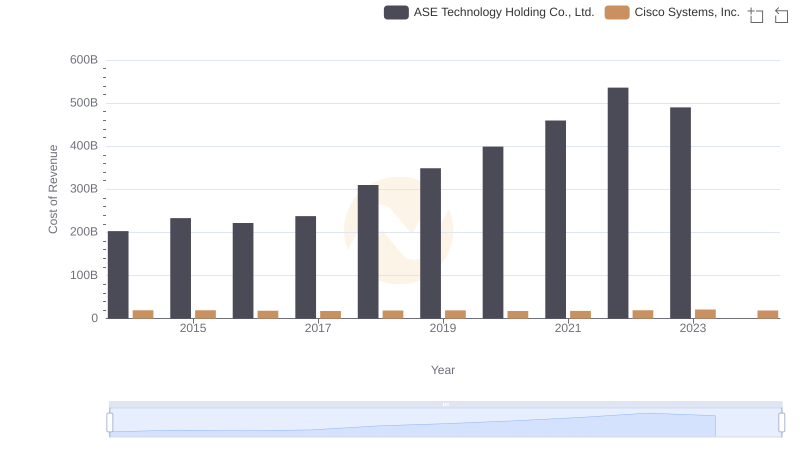
Analyzing Cost of Revenue: Cisco Systems, Inc. and ASE Technology Holding Co., Ltd.
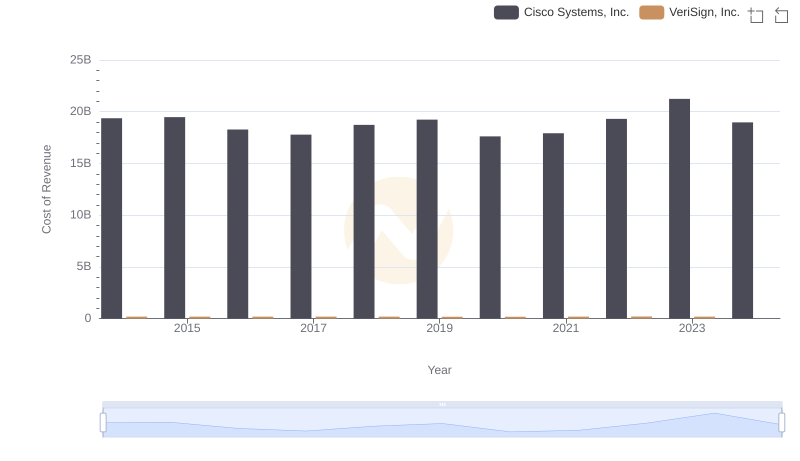
Cost of Revenue: Key Insights for Cisco Systems, Inc. and VeriSign, Inc.
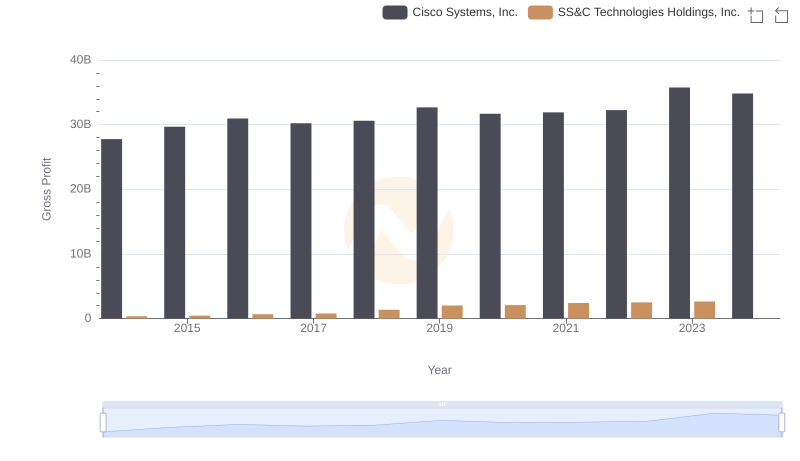
Gross Profit Trends Compared: Cisco Systems, Inc. vs SS&C Technologies Holdings, Inc.
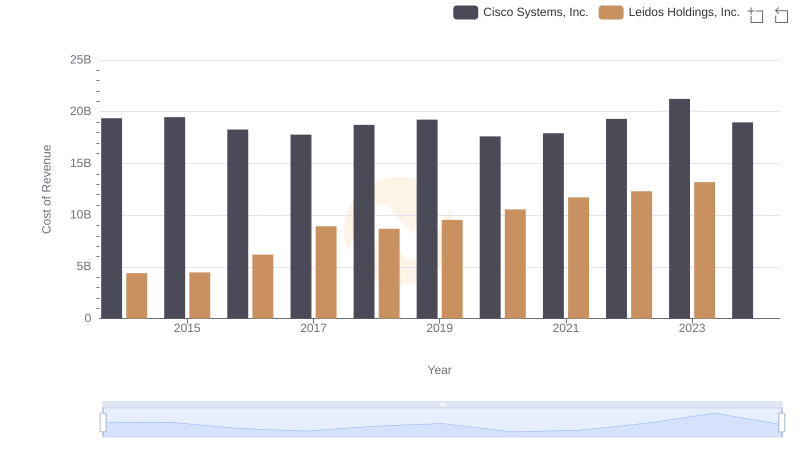
Analyzing Cost of Revenue: Cisco Systems, Inc. and Leidos Holdings, Inc.
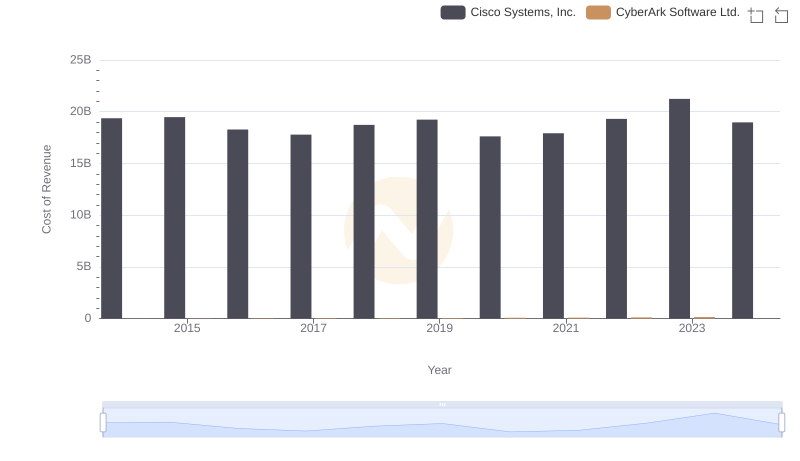
Cisco Systems, Inc. vs CyberArk Software Ltd.: Efficiency in Cost of Revenue Explored
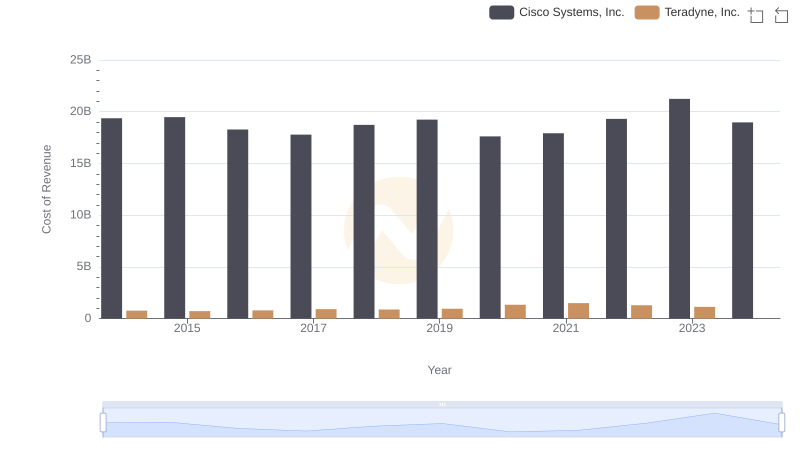
Cost of Revenue Comparison: Cisco Systems, Inc. vs Teradyne, Inc.
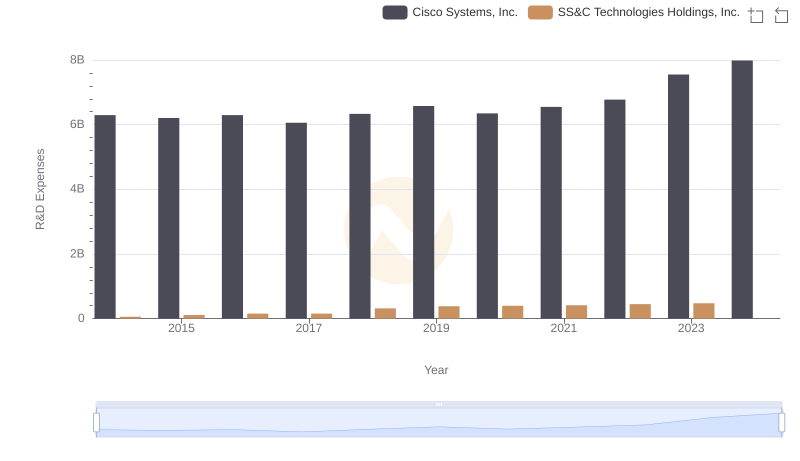
R&D Insights: How Cisco Systems, Inc. and SS&C Technologies Holdings, Inc. Allocate Funds
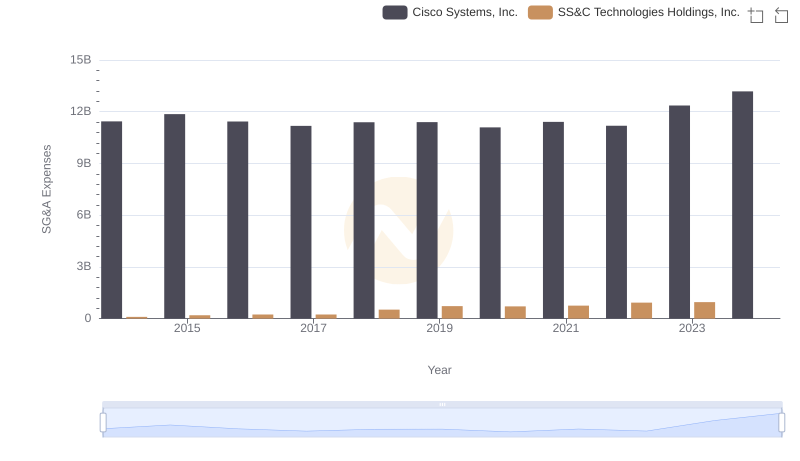
Cisco Systems, Inc. and SS&C Technologies Holdings, Inc.: SG&A Spending Patterns Compared
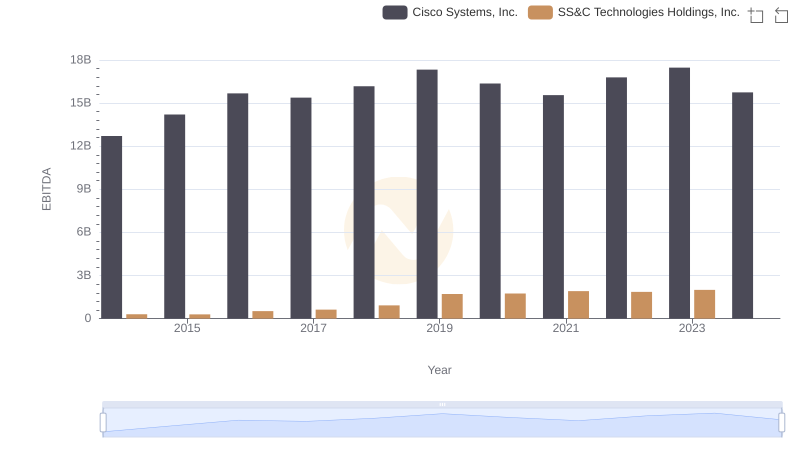
Cisco Systems, Inc. vs SS&C Technologies Holdings, Inc.: In-Depth EBITDA Performance Comparison