| __timestamp | Cisco Systems, Inc. | SS&C Technologies Holdings, Inc. |
|---|---|---|
| Wednesday, January 1, 2014 | 27769000000 | 357130000 |
| Thursday, January 1, 2015 | 29681000000 | 467935000 |
| Friday, January 1, 2016 | 30960000000 | 680947000 |
| Sunday, January 1, 2017 | 30224000000 | 788870000 |
| Monday, January 1, 2018 | 30606000000 | 1370000000 |
| Tuesday, January 1, 2019 | 32666000000 | 2021200000 |
| Wednesday, January 1, 2020 | 31683000000 | 2093800000 |
| Friday, January 1, 2021 | 31894000000 | 2409300000 |
| Saturday, January 1, 2022 | 32248000000 | 2515300000 |
| Sunday, January 1, 2023 | 35753000000 | 2651800000 |
| Monday, January 1, 2024 | 34828000000 | 2863600000 |
Igniting the spark of knowledge
In the ever-evolving landscape of technology, understanding financial trends is crucial. This analysis compares the gross profit trajectories of two industry giants: Cisco Systems, Inc. and SS&C Technologies Holdings, Inc., from 2014 to 2023. Cisco, a leader in networking solutions, has shown a steady increase in gross profit, peaking at approximately $35.8 billion in 2023, a 29% rise from 2014. In contrast, SS&C Technologies, a key player in financial services software, experienced a remarkable growth of over 640% in the same period, reaching around $2.65 billion in 2023. However, data for 2024 is incomplete, highlighting the need for continuous monitoring. This comparison underscores the dynamic nature of the tech industry, where both established and emerging companies can achieve significant financial growth.
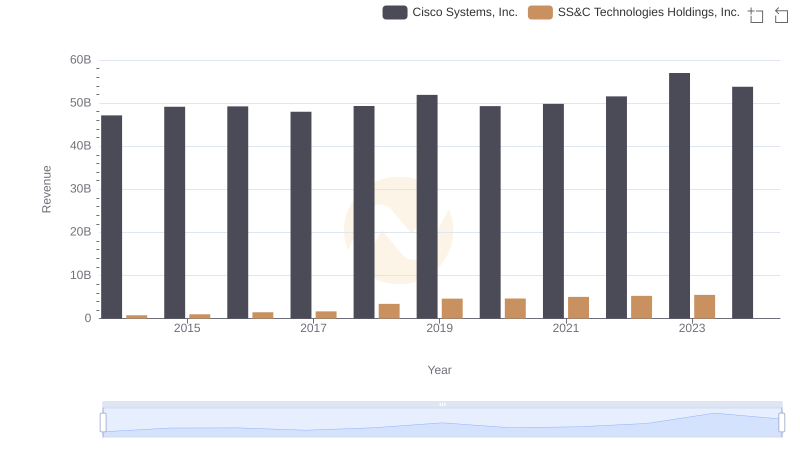
Revenue Showdown: Cisco Systems, Inc. vs SS&C Technologies Holdings, Inc.
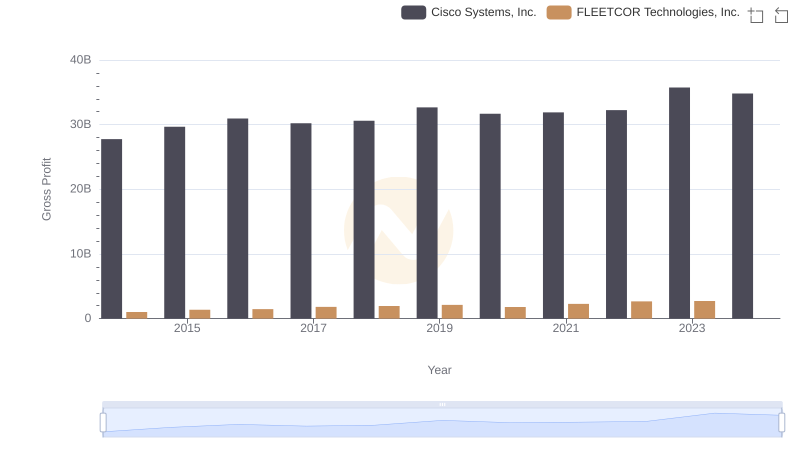
Gross Profit Analysis: Comparing Cisco Systems, Inc. and FLEETCOR Technologies, Inc.
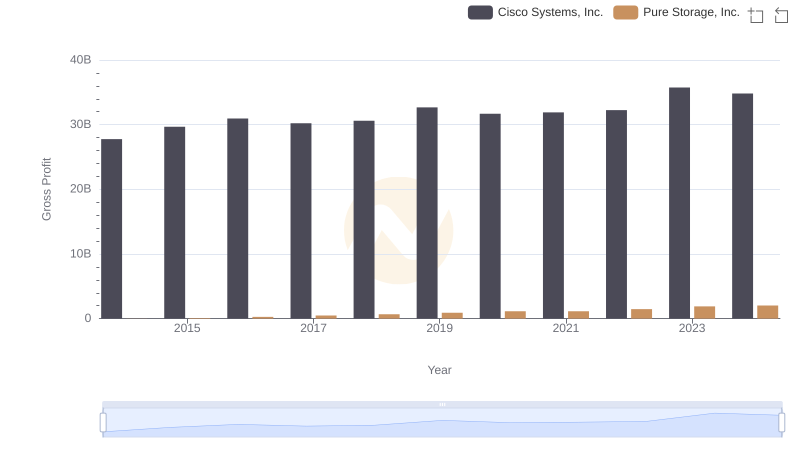
Gross Profit Comparison: Cisco Systems, Inc. and Pure Storage, Inc. Trends
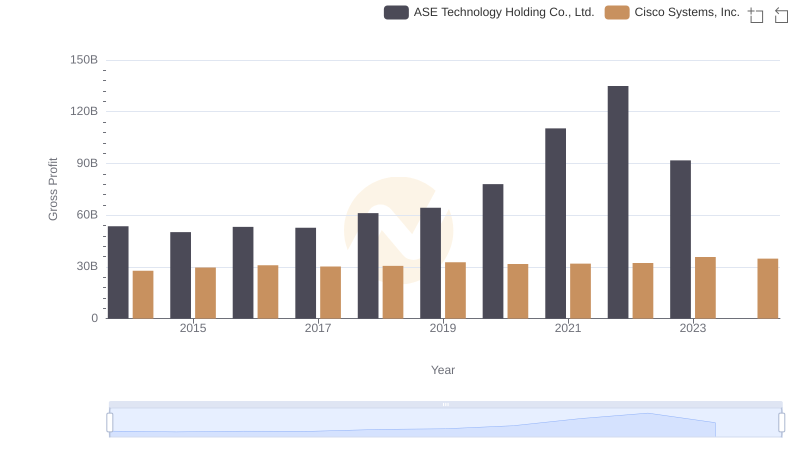
Cisco Systems, Inc. vs ASE Technology Holding Co., Ltd.: A Gross Profit Performance Breakdown
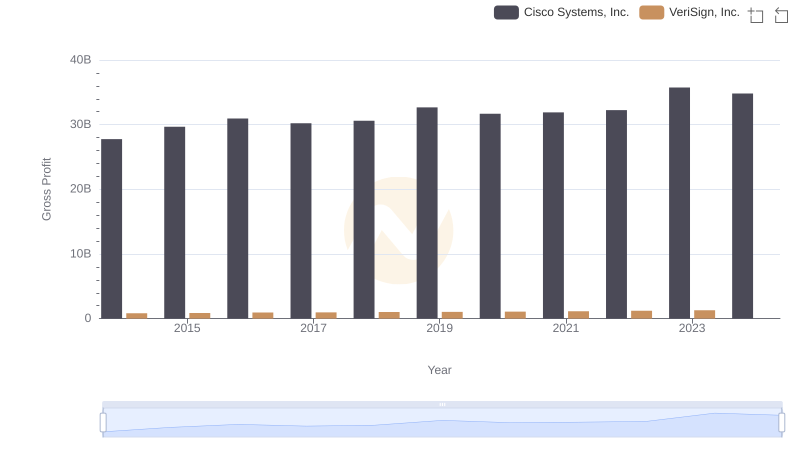
Cisco Systems, Inc. vs VeriSign, Inc.: A Gross Profit Performance Breakdown
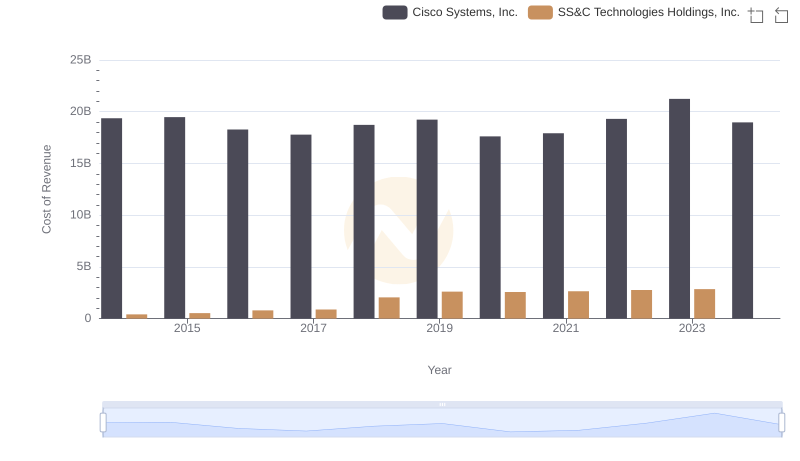
Cisco Systems, Inc. vs SS&C Technologies Holdings, Inc.: Efficiency in Cost of Revenue Explored
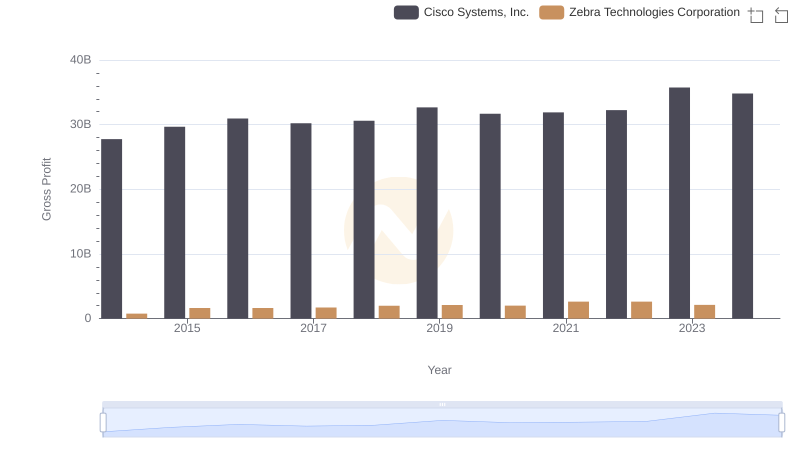
Key Insights on Gross Profit: Cisco Systems, Inc. vs Zebra Technologies Corporation
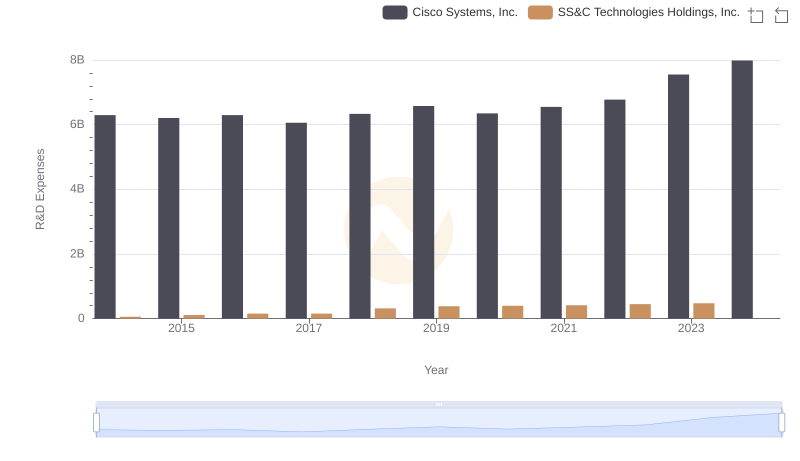
R&D Insights: How Cisco Systems, Inc. and SS&C Technologies Holdings, Inc. Allocate Funds

Gross Profit Analysis: Comparing Cisco Systems, Inc. and Leidos Holdings, Inc.
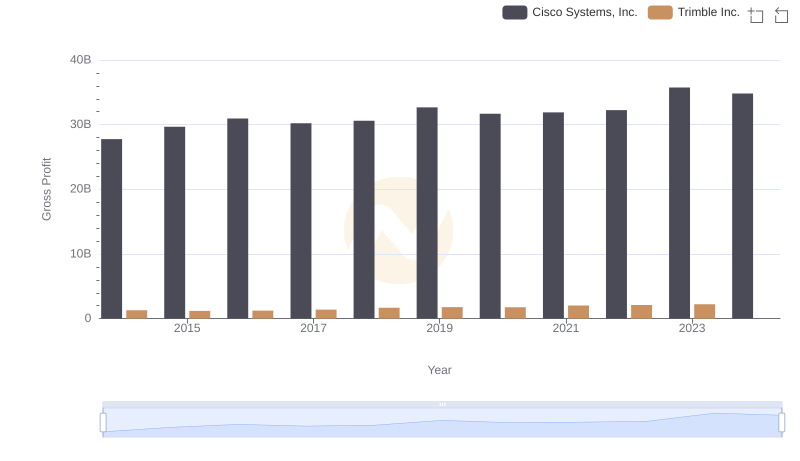
Key Insights on Gross Profit: Cisco Systems, Inc. vs Trimble Inc.
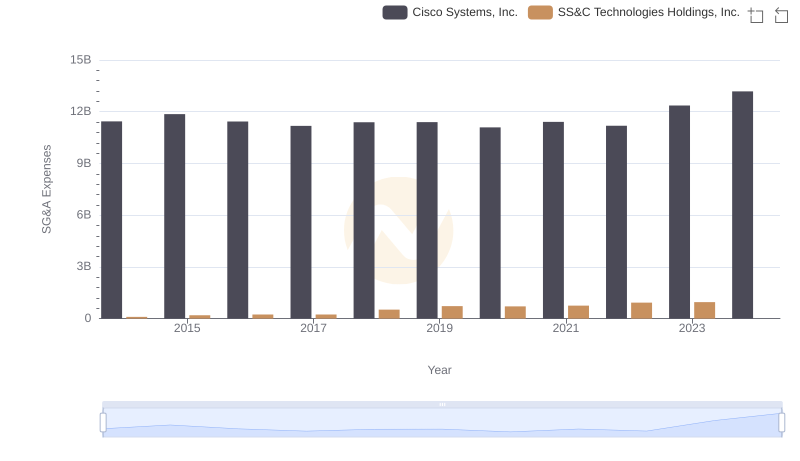
Cisco Systems, Inc. and SS&C Technologies Holdings, Inc.: SG&A Spending Patterns Compared
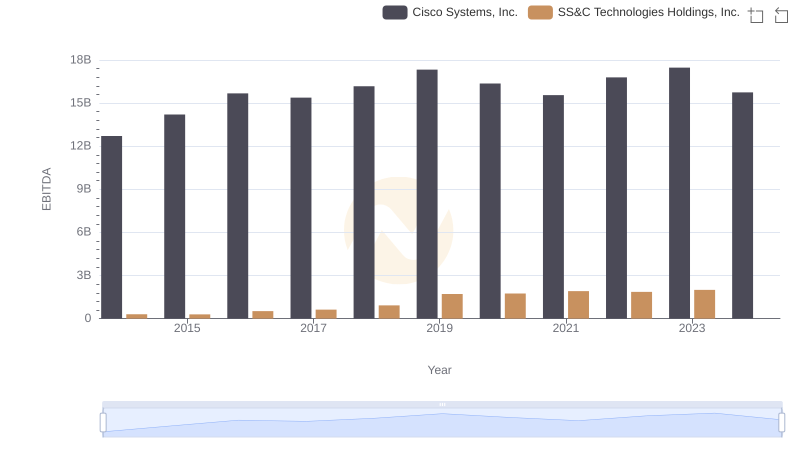
Cisco Systems, Inc. vs SS&C Technologies Holdings, Inc.: In-Depth EBITDA Performance Comparison